What I measure → Testing & Results

What I test — and what it shows

The full panel I track, in my own words and my own images. For the curated deep-dives see Bio-Age & Clocks and Imaging & Body Comp.

The full panel

My testing & results

I am a constant self-experimenter, willing to try anything new to see how it might affect me, my energy, my mood, my blood markers, and my epigenetics.

I test various blood markers monthly, as I continue to change up my supplementation and dosages to shift my various markers not just into their reference range (which is simply an average of an ailing population my age who require a blood test for diagnostics), but instead toward the studied and determined optimal ranges for healthy collegiate athletes.

Ranking on the Leaderboard of The Rejuvenation Olympics now has me notwanting to experiment with new things, lest I negatively affect my standing! That kind of sucks! 🤣😂😛 So if you should ever see my score drop, just know that it's only due to temporary experimentation! 🙂

I have also had my own and each member of my family tested via Ancestry so that I've been able to export our raw data files to compare & contrast our genetics, using tools like Found My Fitness, Promethease, and Microsoft Excel. I am the youngest child of 3 and based upon the sheer number of positive and negative markers, I arguably have the worstgenetics of anyone in my family!

Regular Testing:

Wishlist:

DNA Testing I've Done Over The Years:

DNA Analysis Tools Used:

Life Extension Blood Test Choices Explained:

What tests might YOU be interested in?

The following are listed from the most basic & least expensive to the most comprehensive. The prices listed here are only for relative reference. The actual price may be cheaper due to regular on-going sales.

Very basic tests, equal to or better than what your doctor will order for you each year:

Complete Blood Count (CBC) / Chemistry/ Lipids Panel - $35.00

and Vitamin D, 25-Hydroxy Blood Test - $47.00

-- OR --

Complete Blood Count (CBC) / Chemistry/ Lipids Panel & Vitamin D Combo - $75.00

Slightly Better:

Cardio Core Essentials Panel - $89.00 (contains everything above + ApoB & CRP, but excludes Vitamin D)

you can add the Vitamin D, 25-Hydroxy Blood Test - $47.00

Also a good add-on to the Cardio Core Essentials Panel would be one of the following NMR panels:

NMR LipoProfile ® - $99.00

(contains Total Cholesterol, LDL-C, HDL-C, and Triglycerides, LDL Particle Count [LDL-P] and LDL Particle Size, LP-IR Score [LipoProfile Insulin Resistance]

-- OR --

NMR LipoProfile® PLUS Blood Test - $269.00

(contains everything in the NMR LipoProfile + C-Reactive Protein [CRP], Myeloperoxidase [MPO], and Oxidized LDL [OxLDL])

o C-Reactive Protein (CRP): A measure of systemic inflammation, which is linked to heart disease.

o Myeloperoxidase (MPO): Indicates vascular inflammation and the presence of vulnerable arterial plaque.

o Oxidized LDL (OxLDL): A marker for oxidized cholesterol, which is more prone to cause inflammation and arterial plaque.

Better yet:

Male Comprehensive Hormone Panel Blood Test - $299.00

Female Comprehensive Hormone Panel Blood Test - $299.00

(these contain CBC / Chemistry/ Lipids Panel + thyroid & sex hormones and Cortisol, but excludes Vitamin D. Also contains Total Cholesterol, LDL-C, HDL-C, and Triglycerides from the basic NMR LipoProfile® test, but excludes Particle Count [LDL-P] and LDL Particle Size, LP-IR Score)

And finally, the ultimate test:

Life Extension Male Panel (Elite) Blood Test - $575

Life Extension Female Panel (Elite) Blood Test - $575

(these contain everything in the Comprehensive Hormone Panel + Progesterone, High-sensitivity C-reactive protein [hs-CRP], Homocysteine, Apolipoprotein B, Insulin-like Growth Factor [IGF-1], Insulin, Vitamin D, a full iron panel, and others. Does not include MPO or OxLDL.)

My TruDiagnostic Results:

Get your test here.

Definitions of two epigenetic measures. IEAA (Intrinsic Epigenetic Age Acceleration): a measure describing age acceleration of the body, independent of age-related changes associated with immune aging. EEAA (Extrinsic Epigenetic Age Acceleration): calculates age acceleration and includes the immune system, thus capturing immune aging.
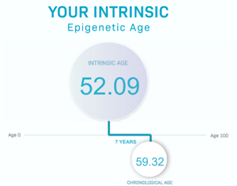
TruDiagnostic intrinsic epigenetic age 52.09 against a chronological age of 59.32 — 7 years younger.

January 7, 2022

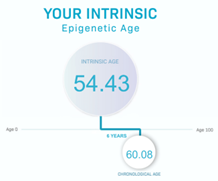
TruDiagnostic intrinsic epigenetic age 54.43 against a chronological age of 60.08 — 6 years younger.

October 9, 2022

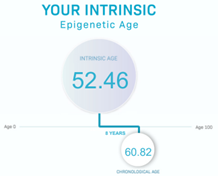
TruDiagnostic intrinsic epigenetic age 52.46 against a chronological age of 60.82 — 8 years younger.

August 15, 2023

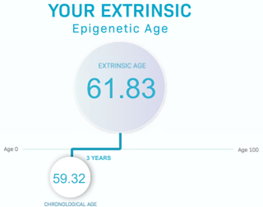
TruDiagnostic extrinsic epigenetic age 61.83 against a chronological age of 59.32 — 3 years older.

January 7, 2022

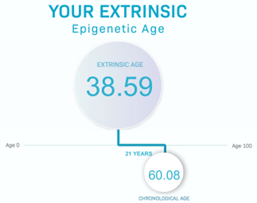
TruDiagnostic extrinsic epigenetic age 38.59 against a chronological age of 60.08 — 21 years younger.

October 9, 2022

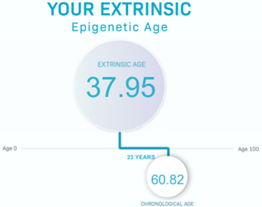
TruDiagnostic extrinsic epigenetic age 37.95 against a chronological age of 60.82 — 23 years younger.

August 15, 2023

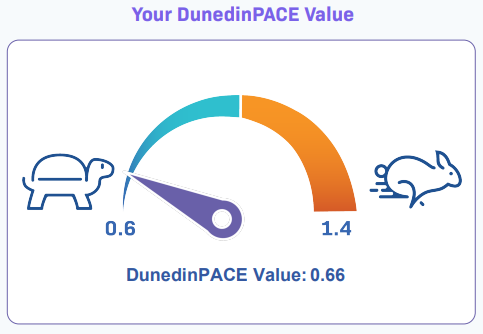
DunedinPACE dial reading 0.66 on a scale from 0.6 (tortoise) to 1.4 (hare) — a pace of ageing well below the 1.0 par rate.

My Pace of Aging as of August 15, 2023
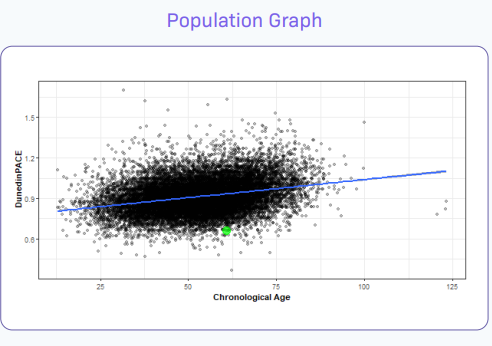
Population scatter plot of DunedinPACE against chronological age. The cloud centres near 0.9 and trends upward with age; Dave's result is marked as a green point at about 0.66 at age 61, below the trend line.

My result compared to the general population, as of August 15, 2023

My GlycanAge Results:

Get your test here.

July 13, 2023

Coming January 2024

Biological age result card reading 49 against a chronological age of 60 — “Great news! Your biological age is 11 years younger than your chronological age.”
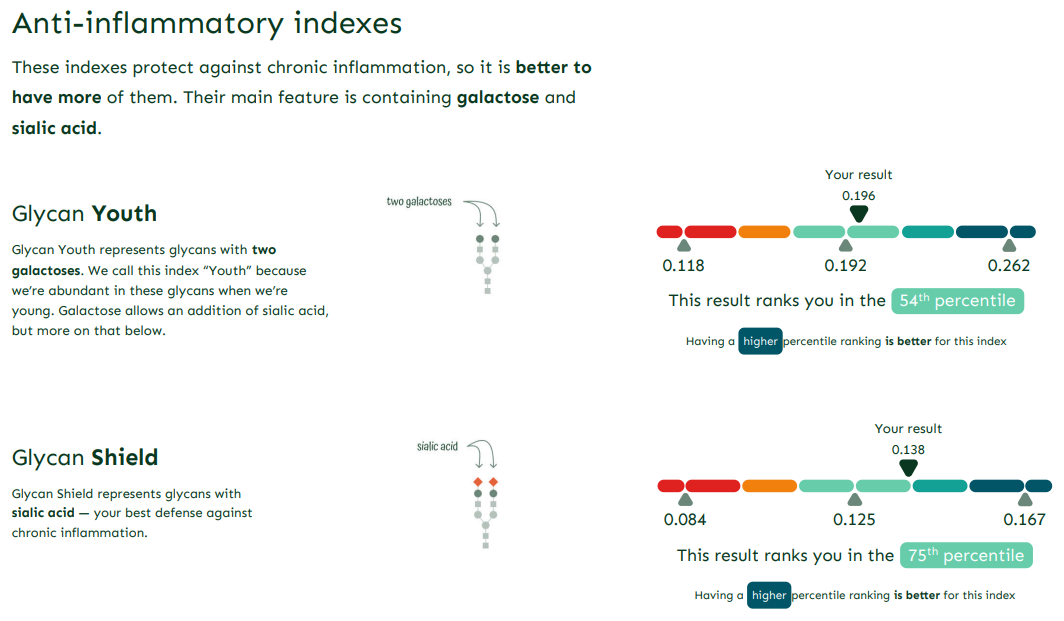
Glycan anti-inflammatory indexes, where higher ranks better. Glycan Youth 0.196, 54th percentile (range 0.118 to 0.262). Glycan Shield 0.138, 75th percentile (range 0.084 to 0.167).
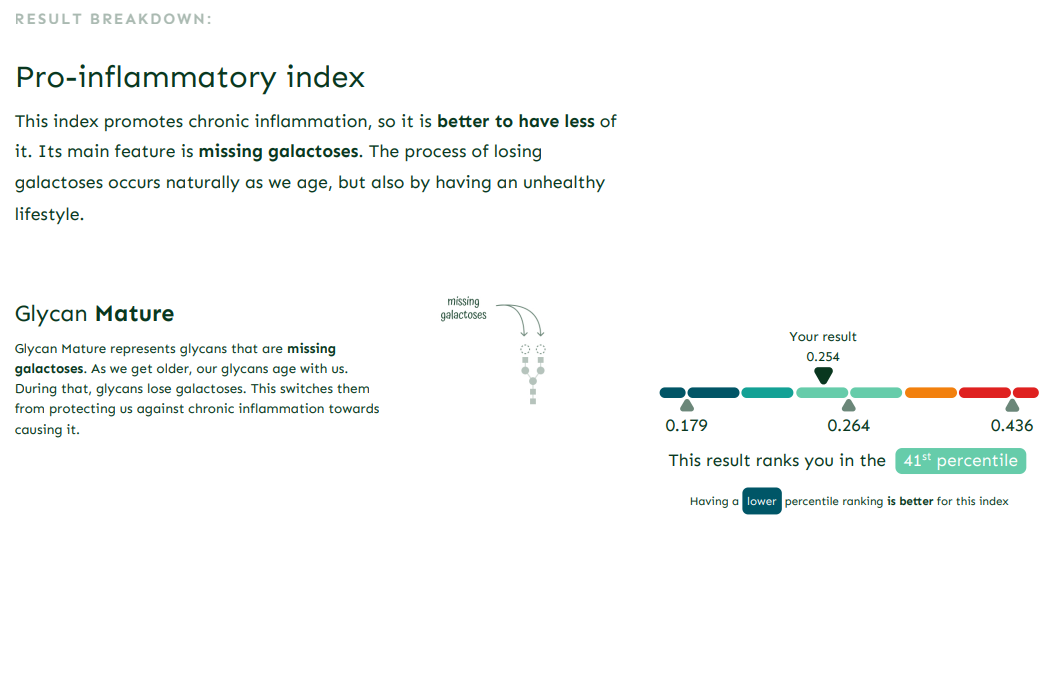
Glycan pro-inflammatory index, where lower ranks better. Glycan Mature 0.254, 41st percentile (range 0.179 to 0.436).
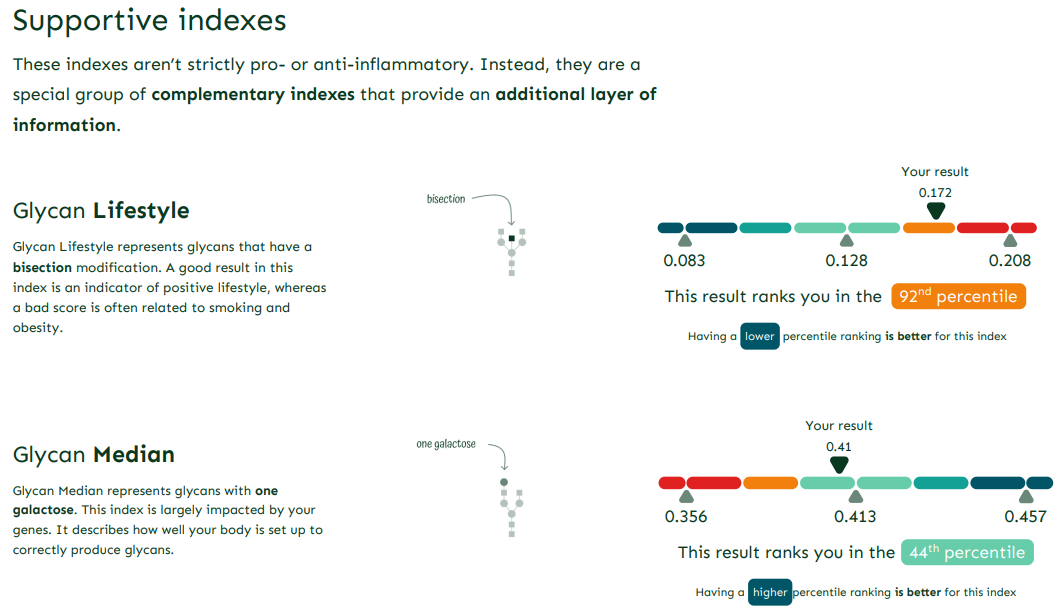
Glycan supportive indexes. Glycan Lifestyle 0.172, 92nd percentile, where lower is better (range 0.083 to 0.208). Glycan Median 0.41, 44th percentile, where higher is better (range 0.356 to 0.457).

Canadian Wildfires recently affected our Air Quality and my Glycans, which increased my biological age value!

My Morgan Levine DNAm PhenoAge Results

As a constant self-experimenter, I've found that attempts to move one marker may have unintended consequences upon another. Sustained training for endurance events also has its impacts. Heck, even things like various endurance fuels have shown their impacts on my markers, such as my blood glucose measures. Many potential inputs, so very many potential outputs.

I do realize that these numbers on their own aren't going to provide much without me also providing the corresponding explanation of what I changed during the testing interval and why. Sorry, I'm no Michael Lustgarten, PhD. I don't weigh my food or calculate p-values, but I do sincerely admire everything he's doing to provide us with actionable and fascinating data. Still, I've provided my numbers here for those that have requested them, and who like to geek-out on such things as I do.
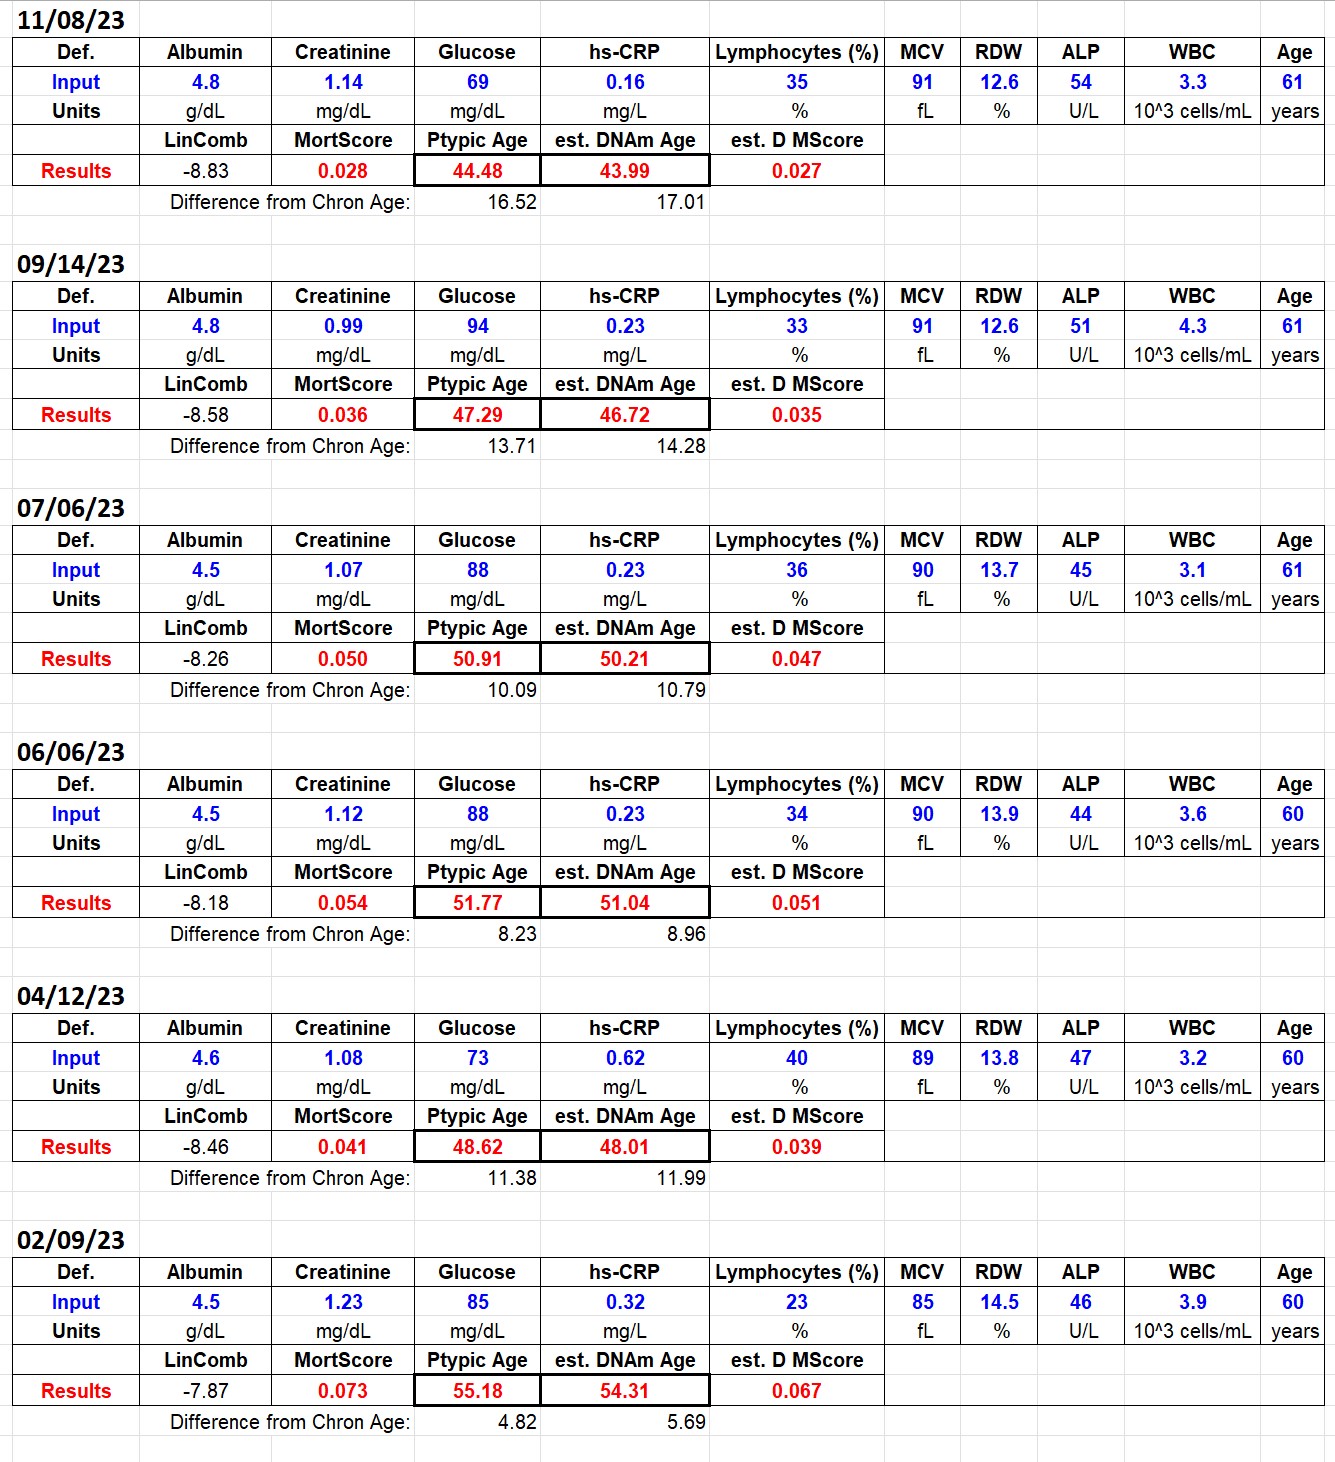
PhenoAge worksheet for six 2023 blood draws. Each block lists albumin, creatinine, glucose, hs-CRP, lymphocyte percentage, MCV, RDW, ALP, WBC and age, then the computed phenotypic age and estimated DNAm age. Phenotypic age runs 55.18 on 9 February (4.82 years below chronological), 48.62 on 12 April, 51.77 on 6 June, 50.91 on 6 July, 47.29 on 14 September and 44.48 on 8 November (16.52 years below chronological).
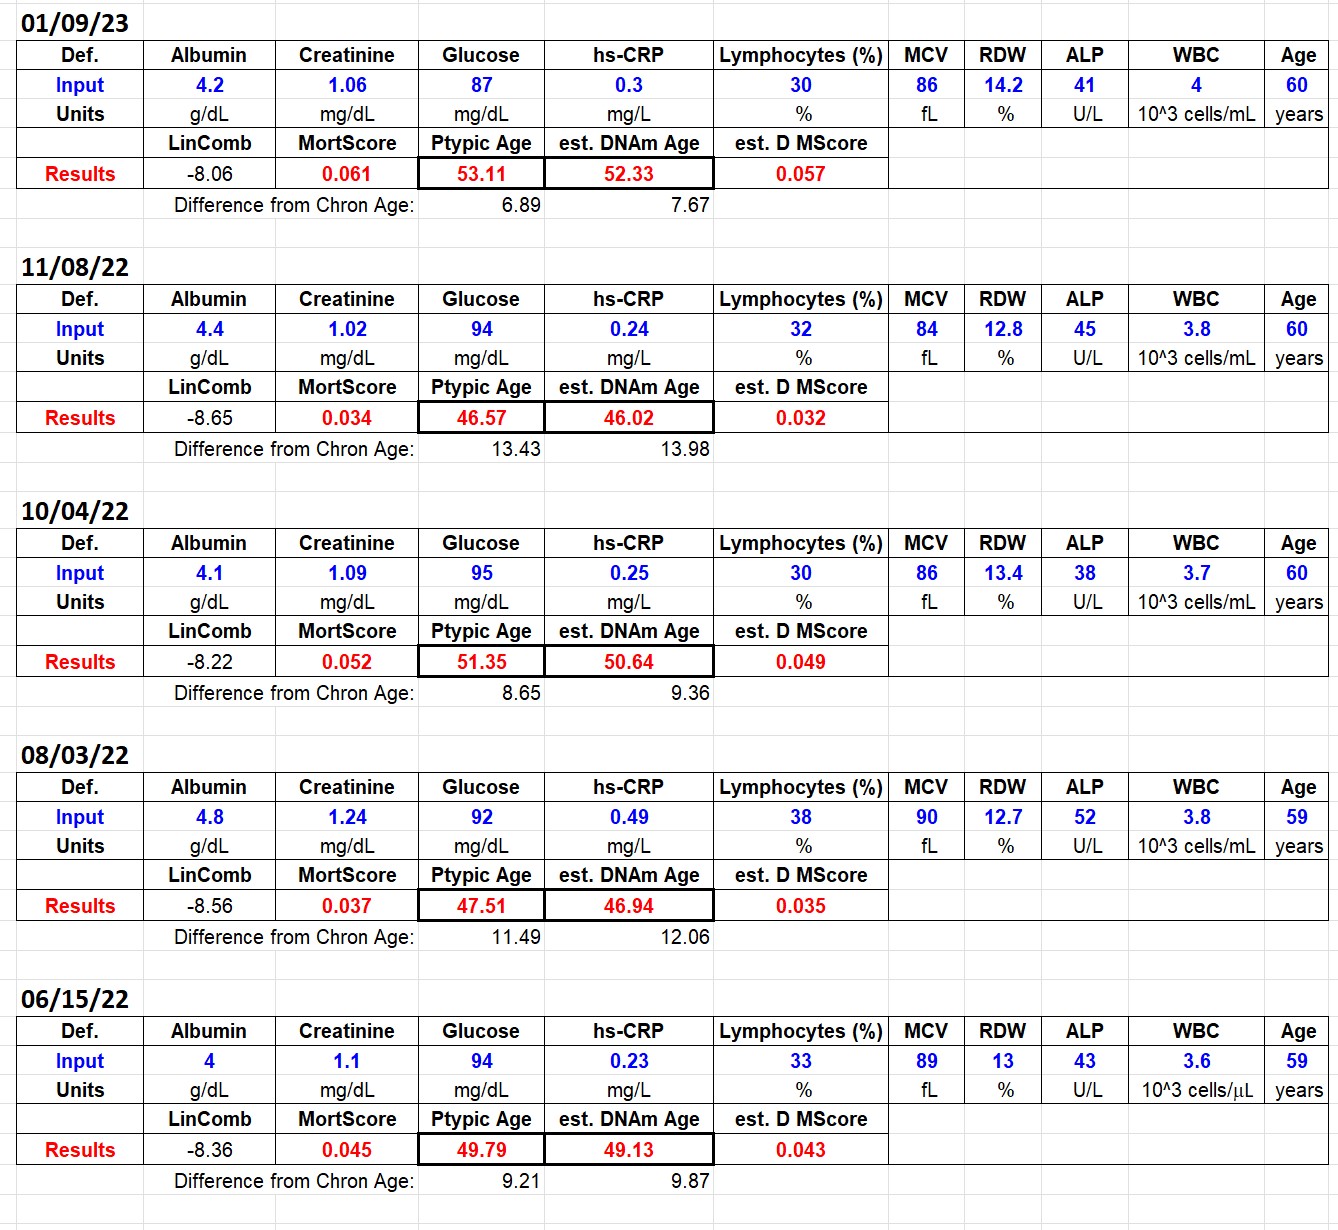
PhenoAge worksheet for five blood draws from 15 June 2022 to 9 January 2023, in the same layout. Phenotypic age is 49.79 on 15 June 2022, 47.51 on 3 August, 51.35 on 4 October, 46.57 on 8 November (13.43 years below chronological) and 53.11 on 9 January 2023.
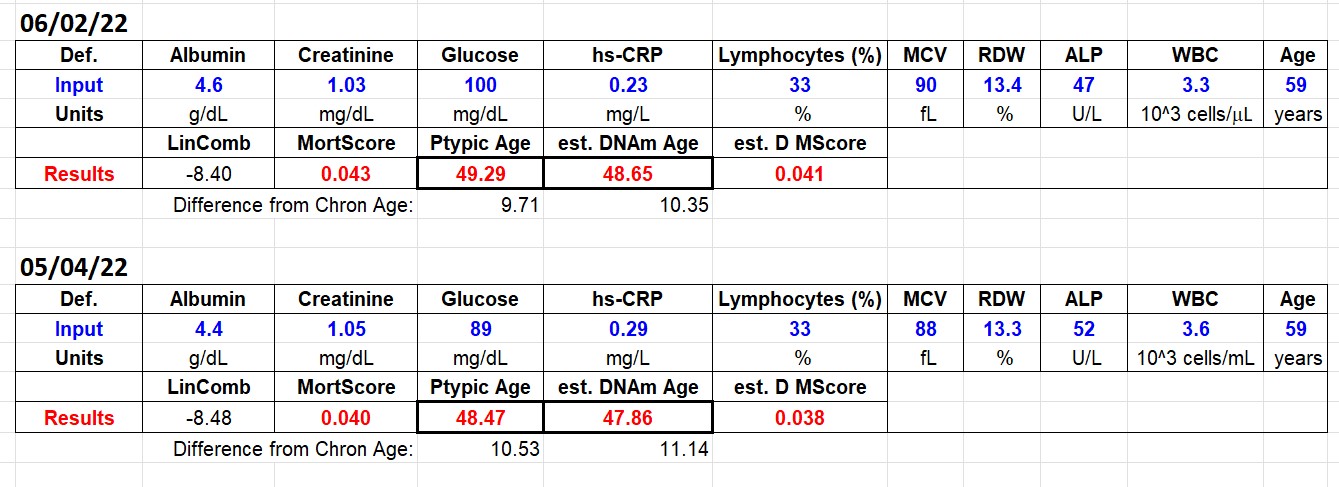
PhenoAge worksheet for two 2022 blood draws — phenotypic age 48.47 on 4 May and 49.29 on 2 June, roughly 10.5 and 9.7 years below chronological age.

Additional Biomarkers:

The following additional biomarkers were requested by Aaron King, since they increase with age but are not influenced by BMI:

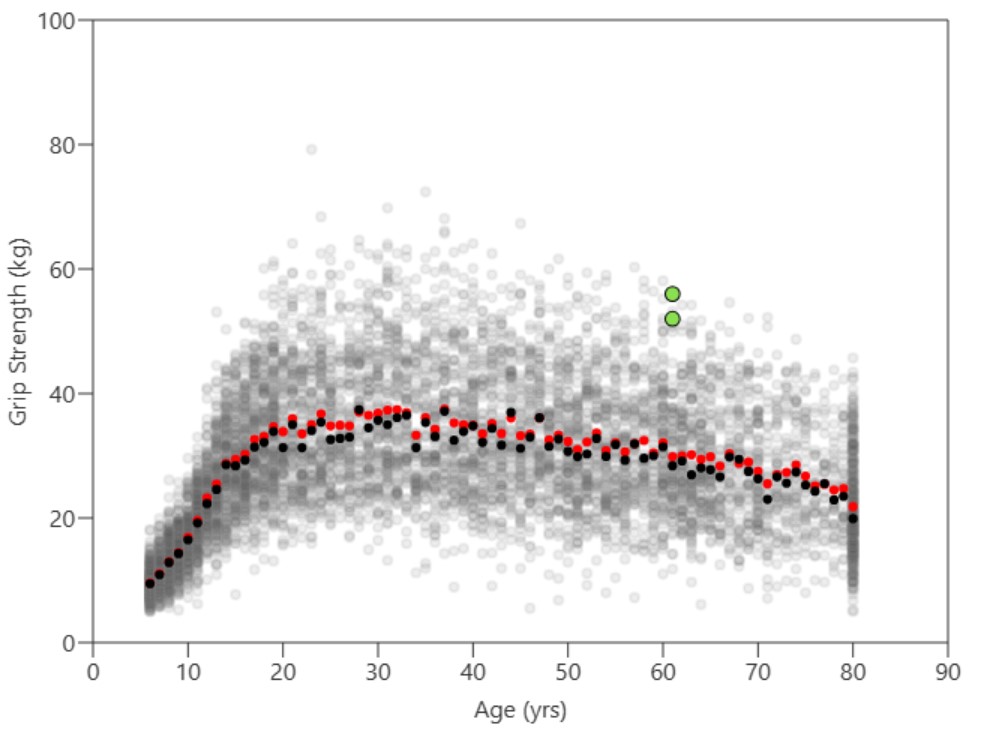
This one surprised me, because I'm left-handed! Due to an old injury, my left forearm and elbow were crackling under the dynamometer load. Ah, it must be hell getting old! 😉😄

Where my results fall compared to the general population:

Graphs derived using agingbiomarkers.info
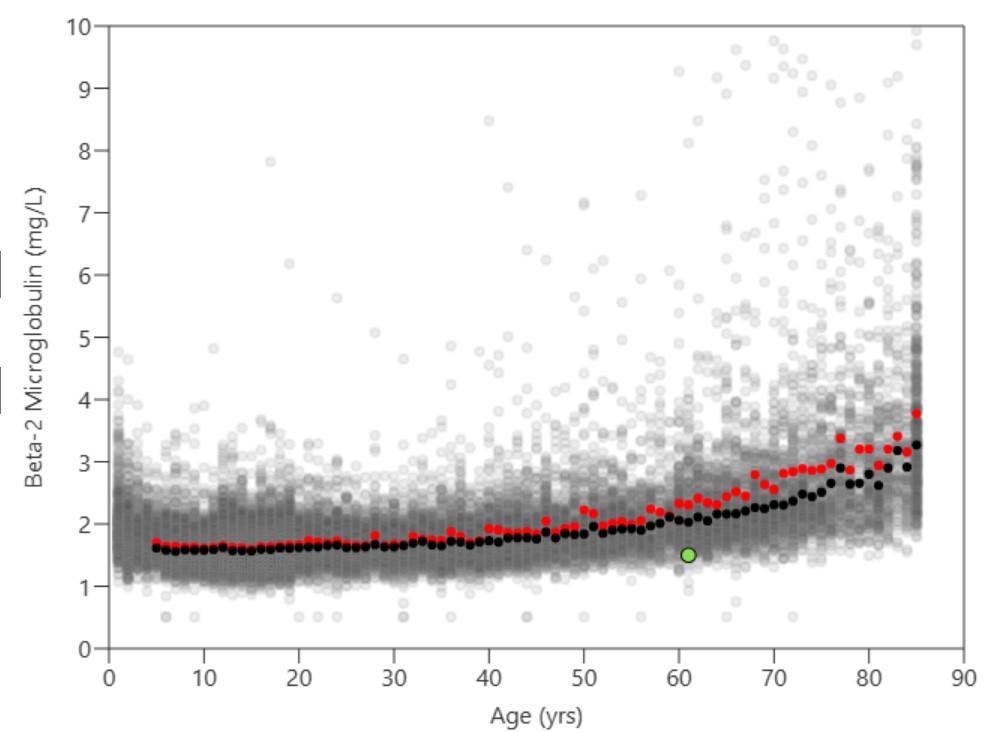
Beta-2 microglobulin plotted against age across a reference population. The population average rises from about 1.7 mg/L in youth to over 3 mg/L by age 85; Dave's result is a green point at about 1.5 mg/L at age 61, below the age-matched average.
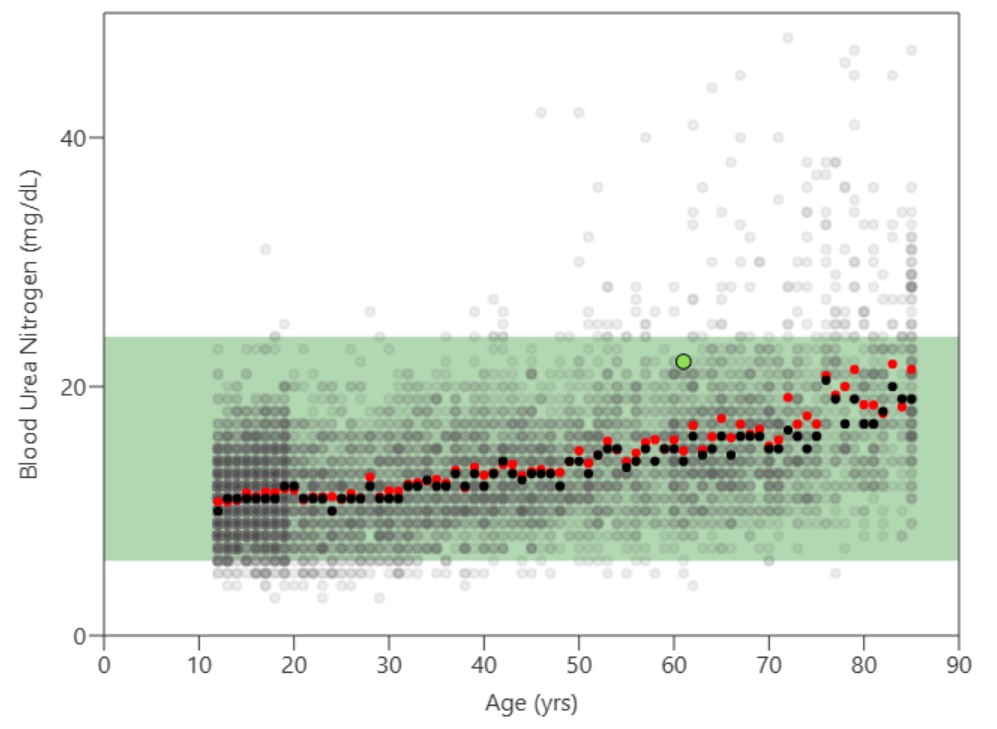
Blood urea nitrogen plotted against age, with the normal range shaded green from about 6 to 24 mg/dL. Dave's result is a green point at roughly 22 mg/dL at age 61, inside the range and above the age-matched average.
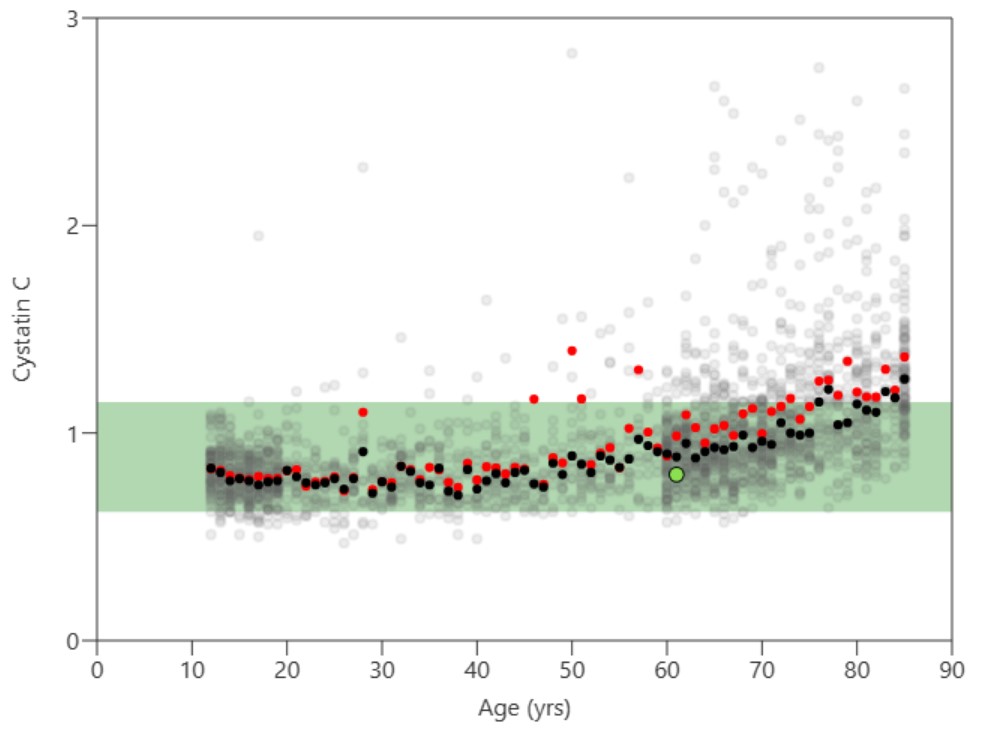
Cystatin C plotted against age, normal range shaded green from about 0.65 to 1.15. Dave's result is a green point at about 0.82 at age 61, inside the range and below the age-matched average.
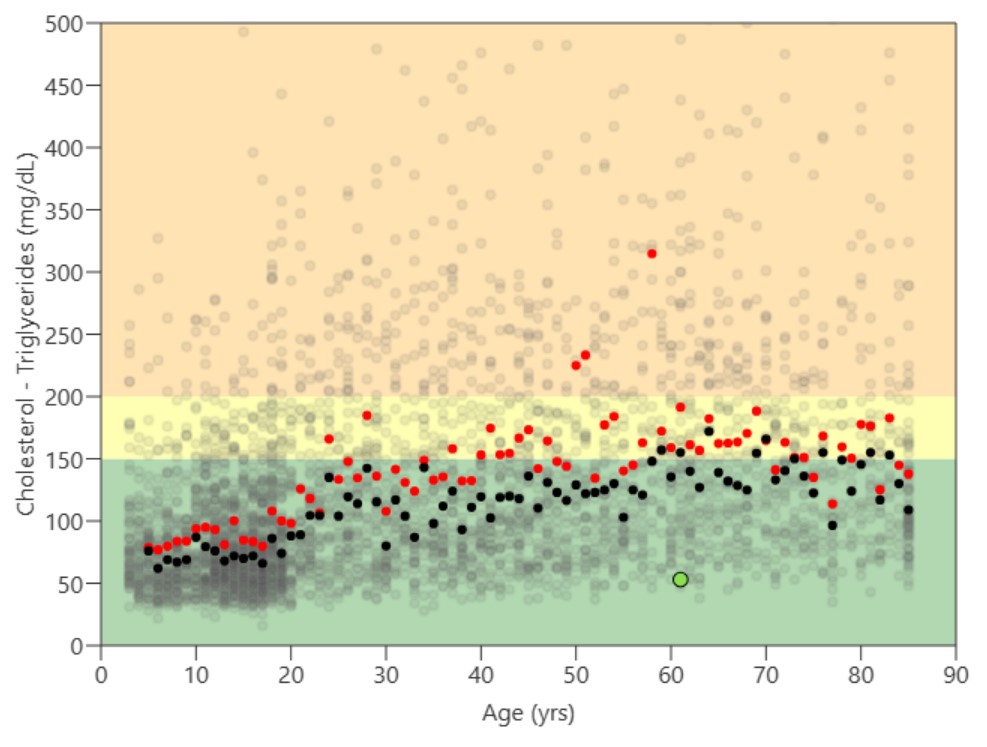
Triglycerides plotted against age, with green, yellow and orange bands at 150 and 200 mg/dL. Dave's result is a green point at about 53 mg/dL at age 61, well inside the optimal band.
Grip strength plotted against age. The population average peaks near 37 kg in the thirties and declines to about 25 kg by 80; Dave's two results are green points at roughly 52 and 56 kg at age 61, far above the age-matched average.
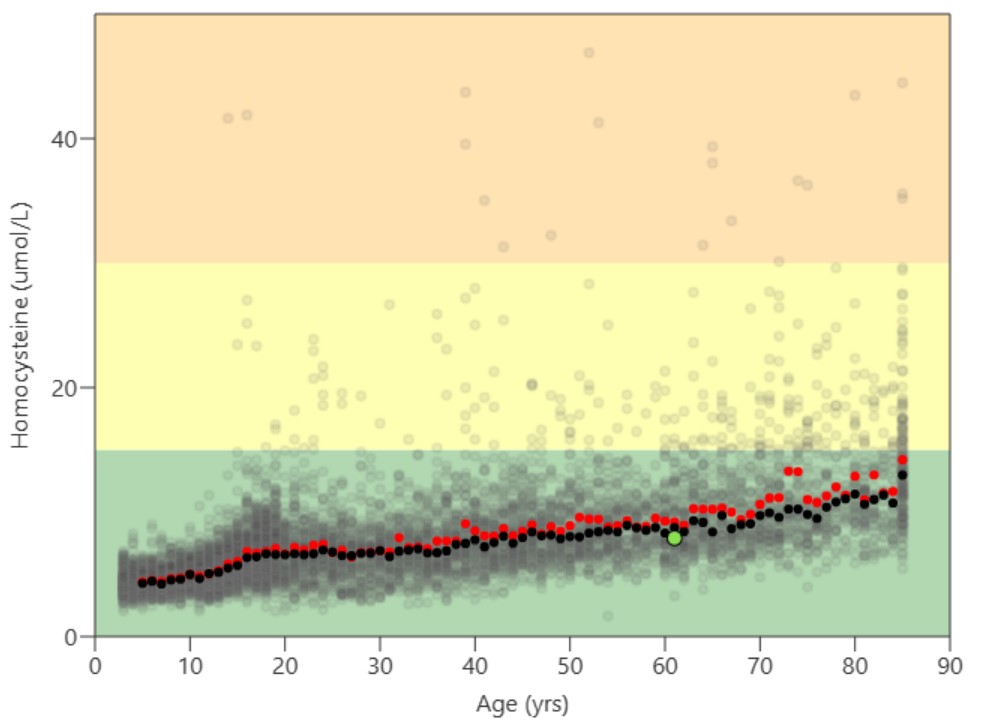
Homocysteine plotted against age, with the optimal band shaded green below about 15 umol/L. Dave's result is a green point at roughly 8 umol/L at age 61, inside the optimal band.
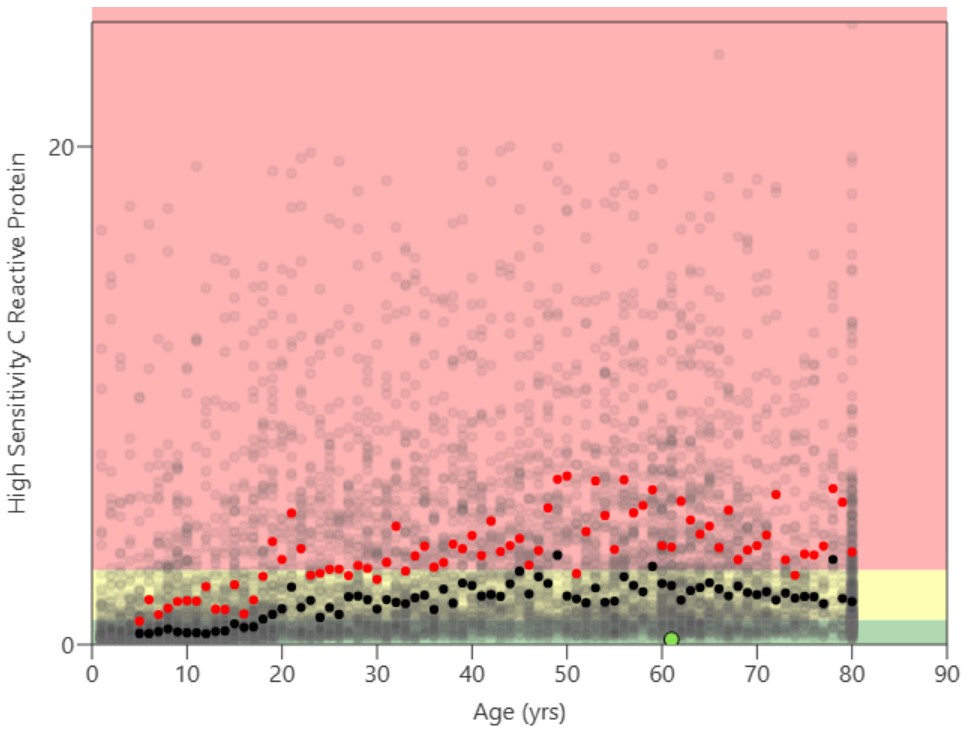
High-sensitivity C-reactive protein plotted against age, most of the chart shaded red above about 3. Dave's result is a green point close to zero at age 61, at the bottom of the range.
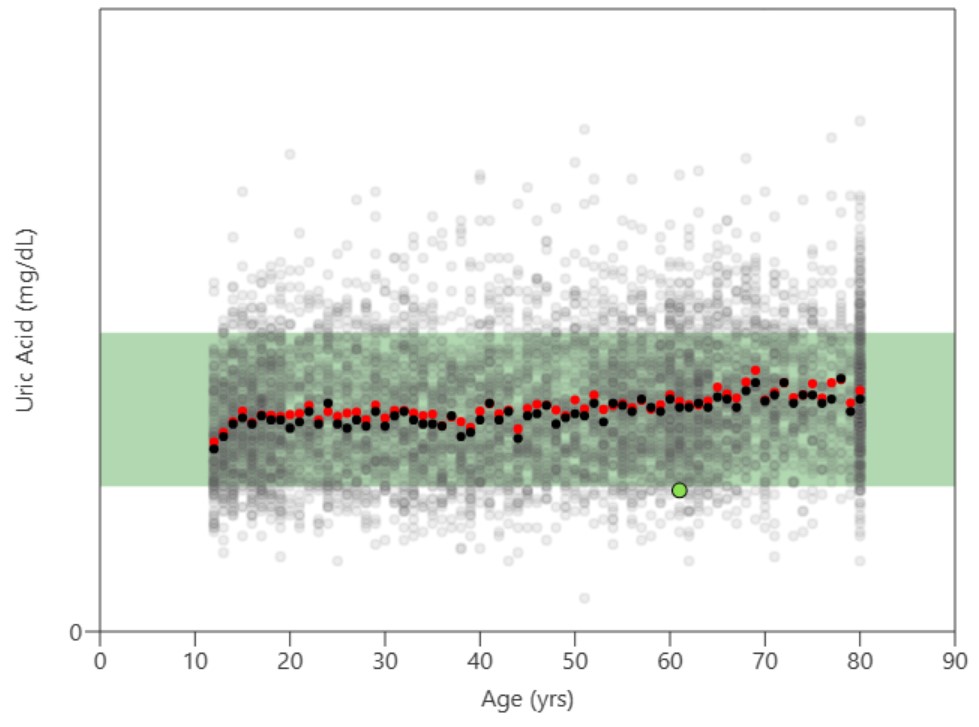
Uric acid plotted against age with the normal range shaded green. Dave's result is a green point at age 61 near the lower edge of the range, below the age-matched average.

DEXA Scan Results
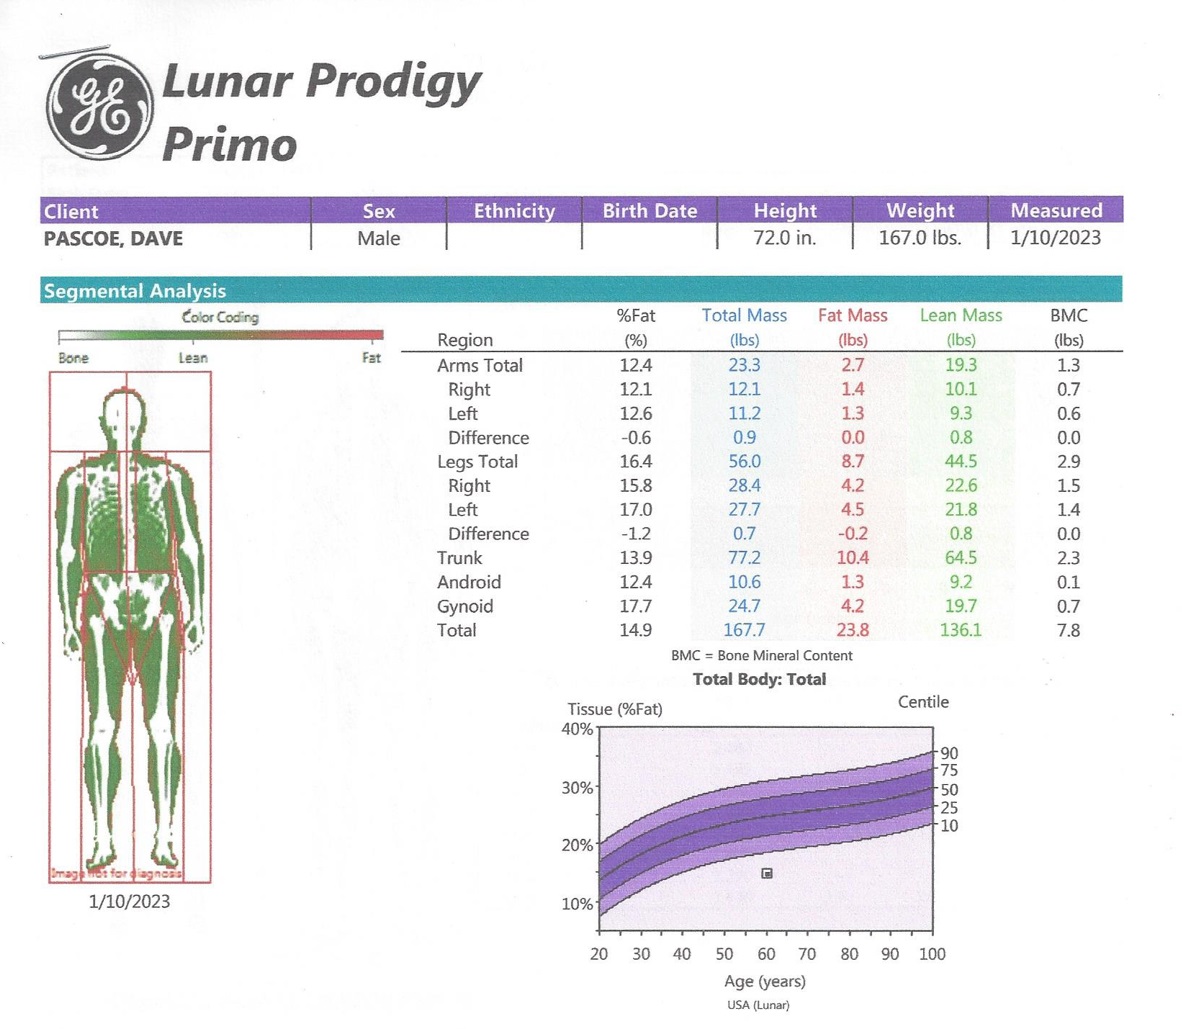
GE Lunar Prodigy DEXA segmental analysis for Dave Pascoe, measured 10 January 2023 at 72 in and 167 lb. Total body 14.9% fat, 167.7 lb total mass, 23.8 lb fat mass, 136.1 lb lean mass, 7.8 lb bone mineral content. By region: arms 12.4% fat, legs 16.4%, trunk 13.9%, android 12.4%, gynoid 17.7%. The percentile chart places him below the 10th centile for body fat at his age.
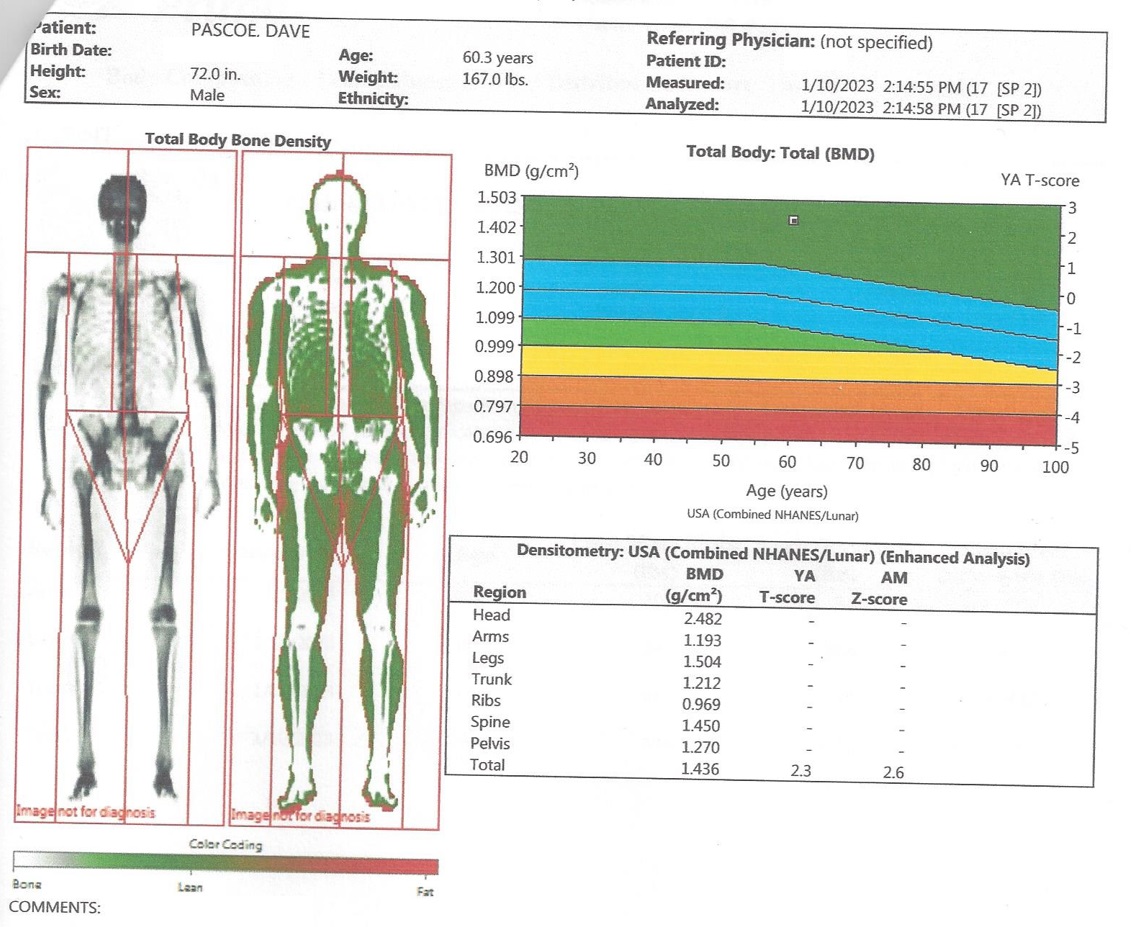
GE Lunar Prodigy total-body bone density report, measured 10 January 2023 at age 60.3. Total bone mineral density 1.436 g/cm2, young-adult T-score 2.3, age-matched Z-score 2.6. By region: head 2.482, arms 1.193, legs 1.504, trunk 1.212, ribs 0.969, spine 1.450, pelvis 1.270 g/cm2.
Cover page of the DexaFit Detroit body-composition report prepared for David Pascoe, measurement date 17 January 2024.
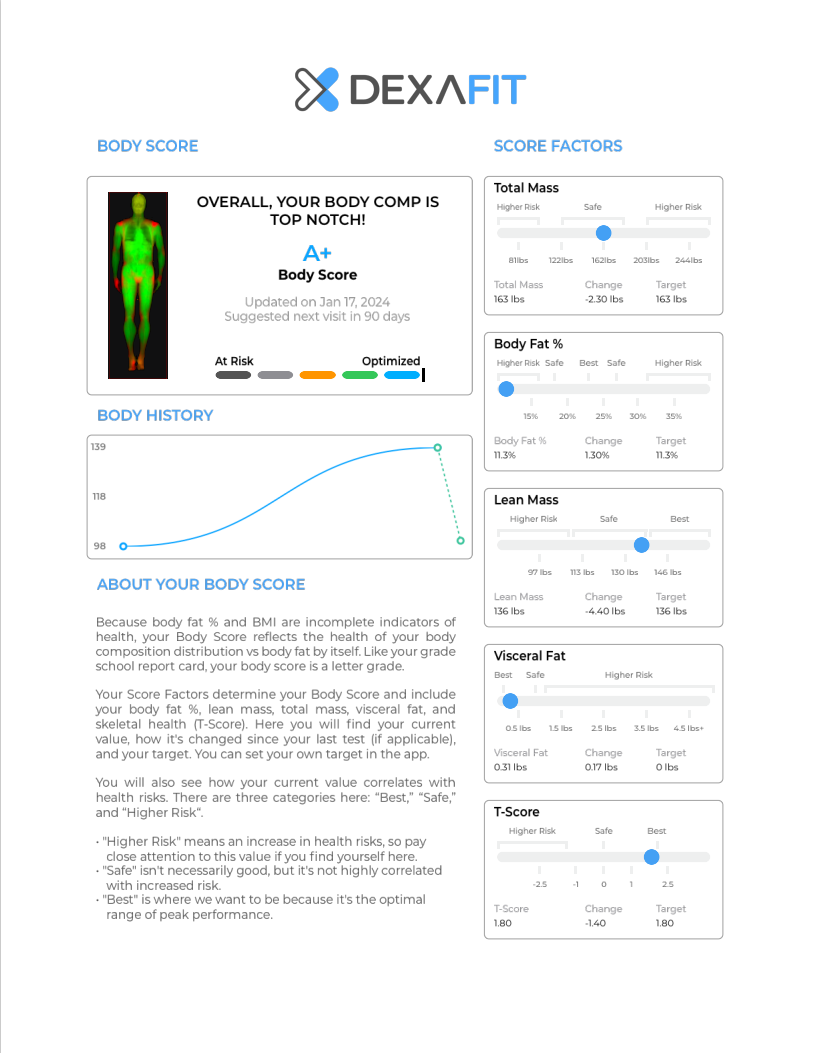
DexaFit body score page, updated 17 January 2024: overall grade A+. Total mass 163 lb (down 2.30 lb), body fat 11.3% (up 1.30 points), lean mass 136 lb (down 4.40 lb), visceral fat 0.31 lb, T-score 1.80.
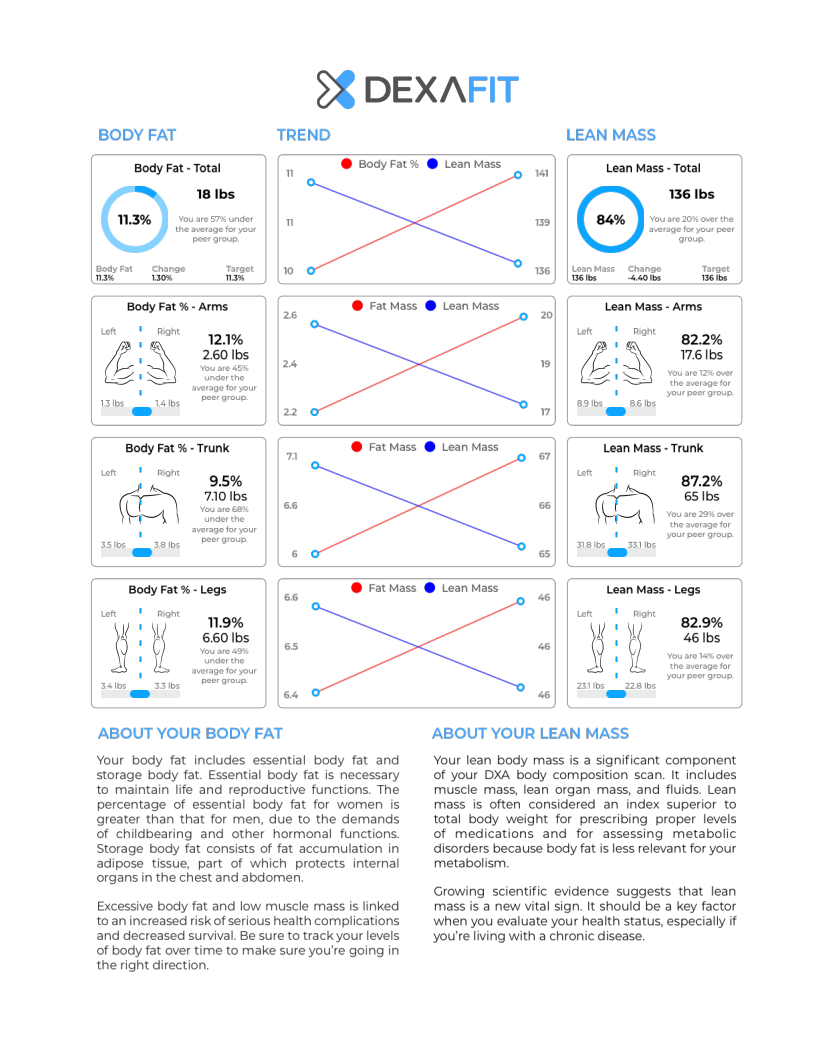
DexaFit body-fat and lean-mass breakdown. Total body fat 11.3%, 18 lb, 57% under the peer-group average. Total lean mass 136 lb, 84%, 20% over the peer-group average. By region — arms 12.1% fat and 82.2% lean, trunk 9.5% fat and 87.2% lean, legs 11.9% fat and 82.9% lean.
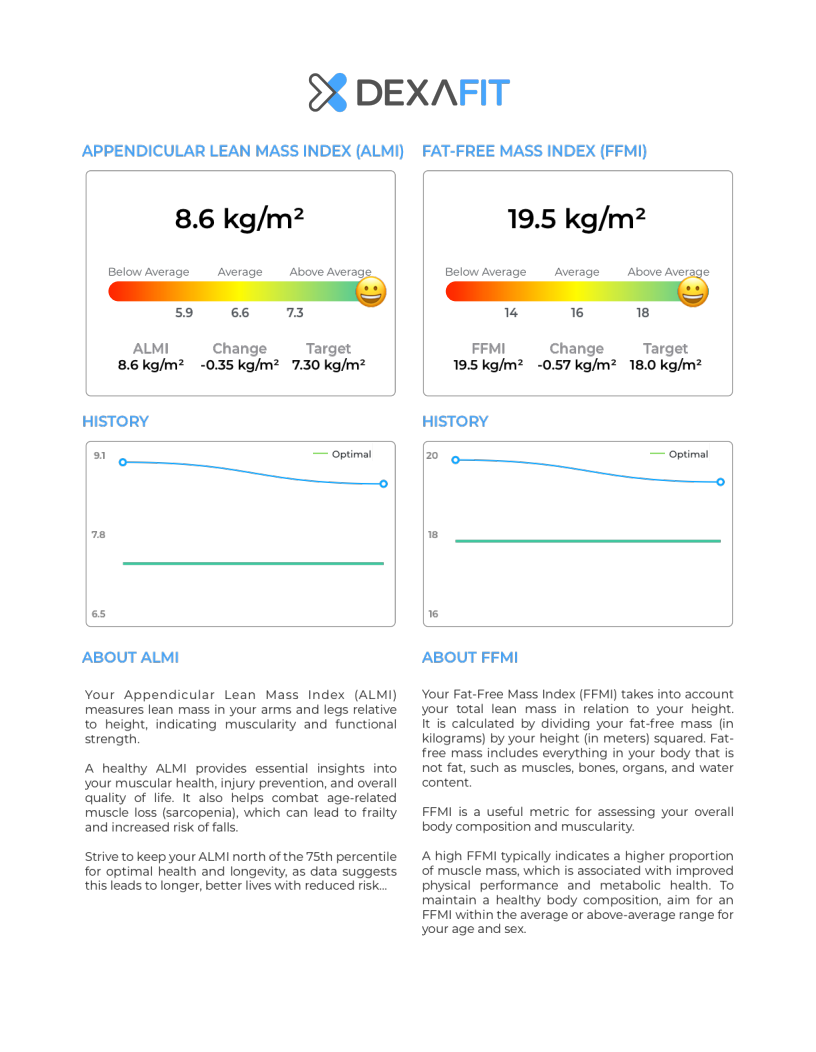
DexaFit lean-mass indexes: appendicular lean mass index 8.6 kg/m2 against an above-average threshold of 7.3, and fat-free mass index 19.5 kg/m2 against an above-average threshold of 18. Both rate above average.
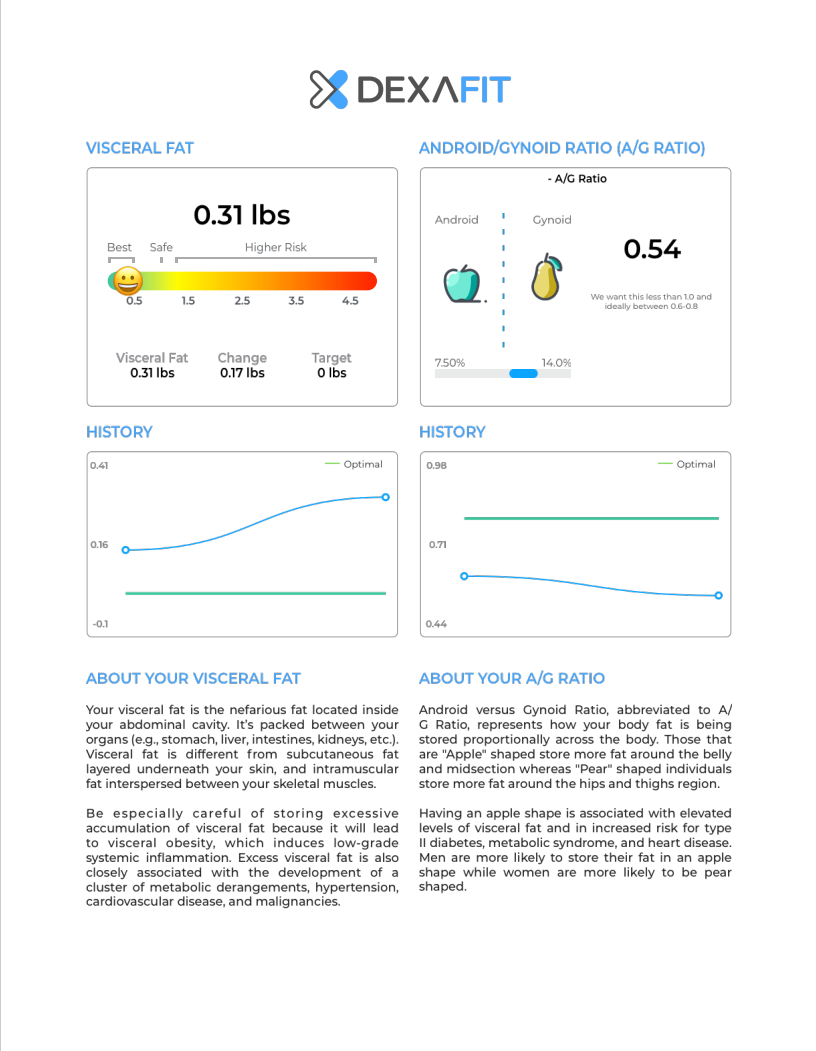
DexaFit visceral fat 0.31 lb, in the best band well below the 1.5 lb safe threshold, and android-to-gynoid ratio 0.54, inside the ideal 0.6-to-0.8 guidance and below the 1.0 ceiling.
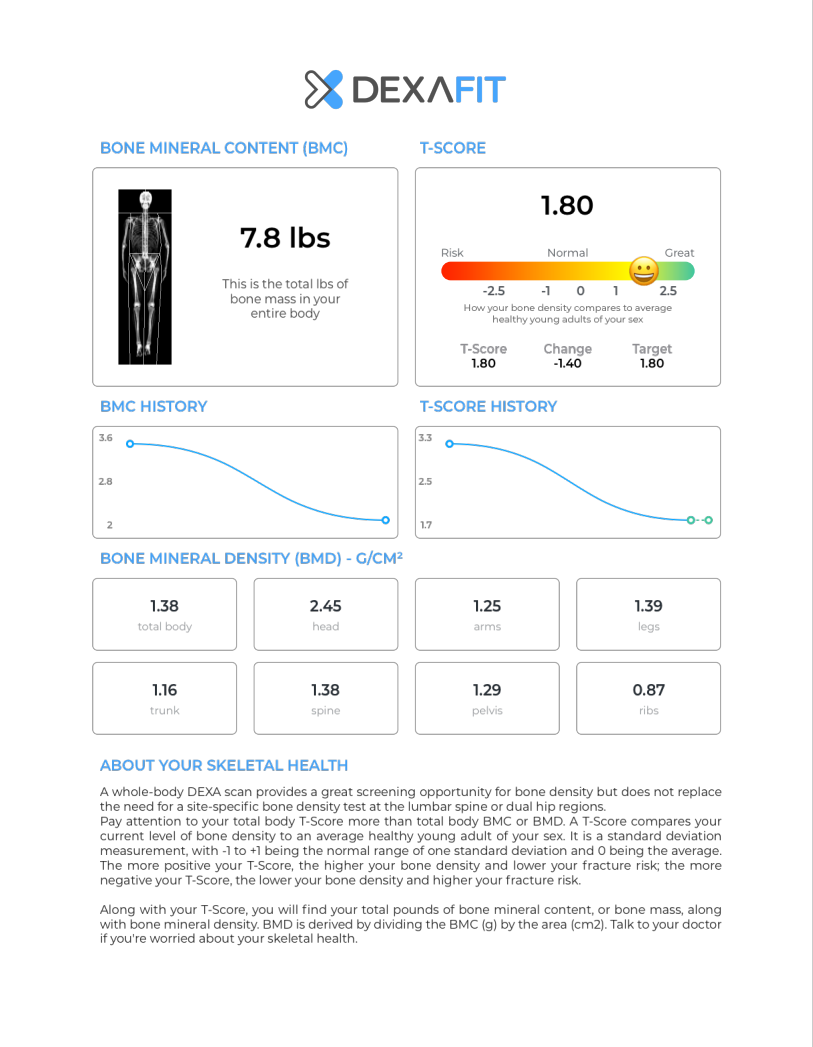
DexaFit skeletal health: 7.8 lb total bone mineral content and a T-score of 1.80, in the “great” band. Bone mineral density by region — total body 1.38, head 2.45, arms 1.25, legs 1.39, trunk 1.16, spine 1.38, pelvis 1.29, ribs 0.87 g/cm2.
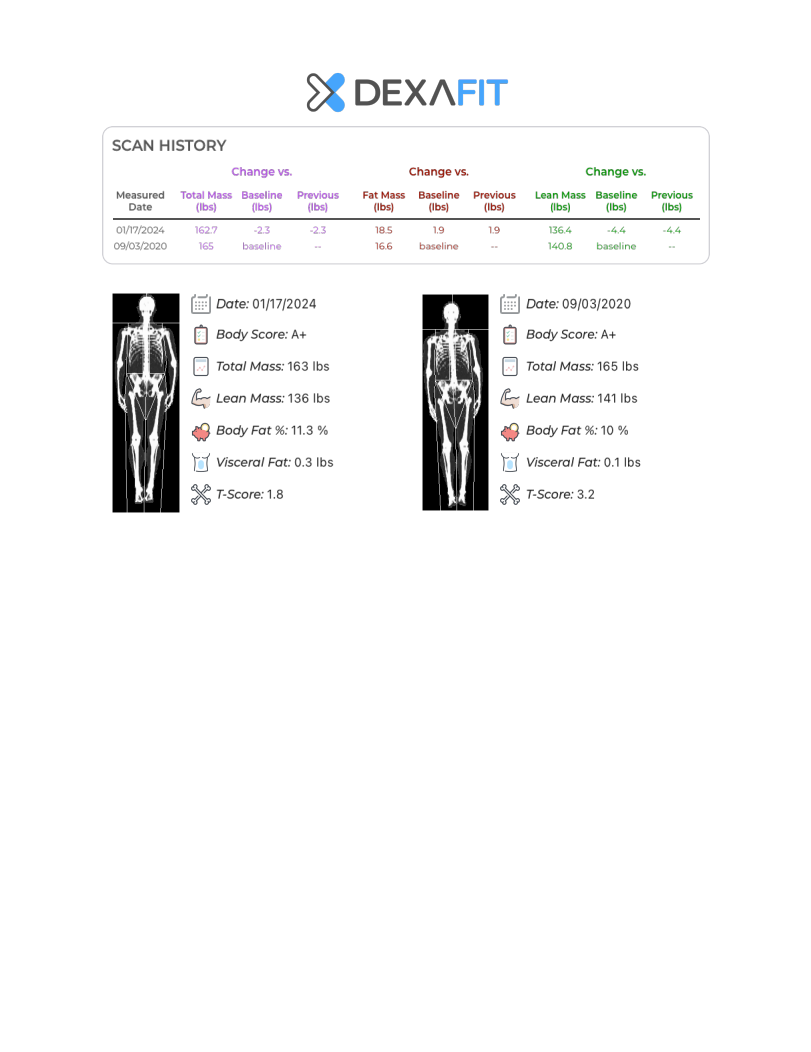
DexaFit scan history comparing 17 January 2024 with the 3 September 2020 baseline. Total mass 162.7 lb versus 165, fat mass 18.5 lb versus 16.6, lean mass 136.4 lb versus 140.8. Both scans graded A+; body fat 11.3% versus 10%, visceral fat 0.3 versus 0.1 lb, T-score 1.8 versus 3.2.
Micronutrients

SpectraCell micronutrient panel

November 2022

In 2022 I went off of all of my supplements for one month just so that I could perform a Micronutrients baseline to establish what I really needed to be supplementing versus what was just a waste of money. I was satisfied with the results because I was already supplementing the things where my levels showed low or that I was deficient in.

These were those results:

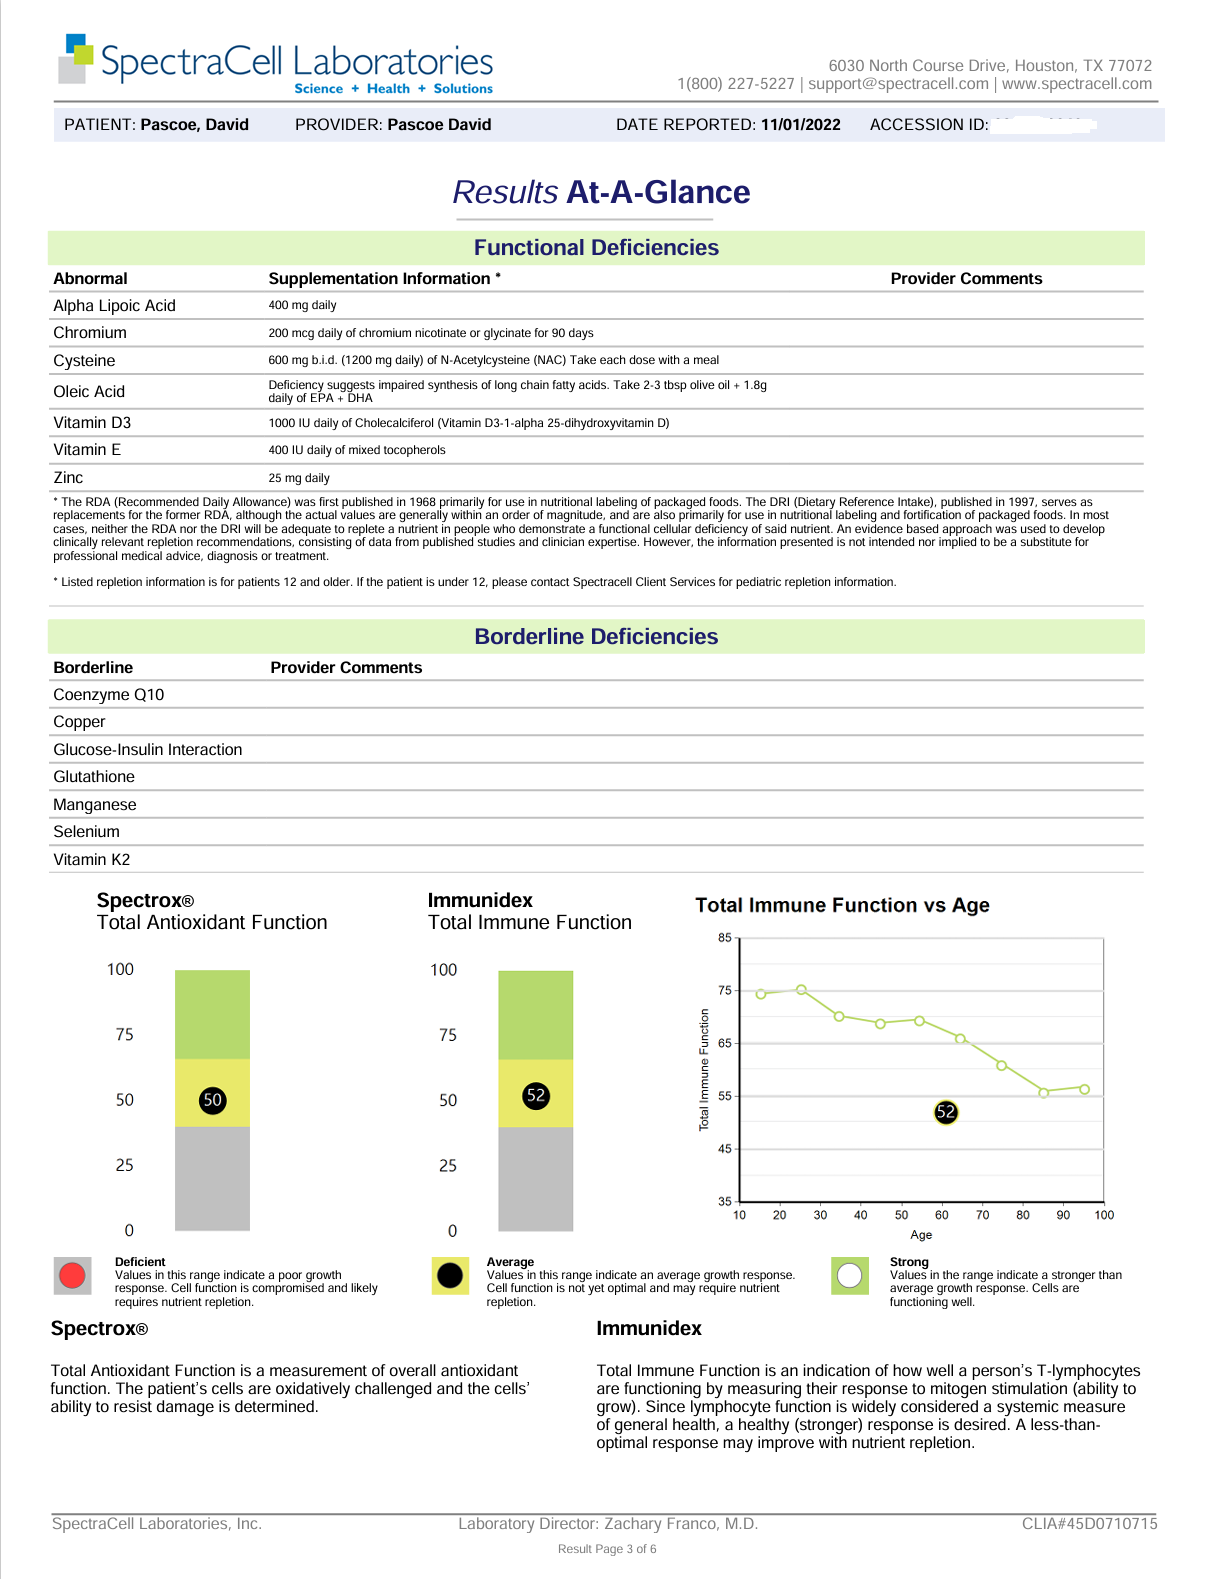
SpectraCell results at a glance for David Pascoe, reported 1 November 2022. Functional deficiencies: alpha lipoic acid, chromium, cysteine, oleic acid, vitamin D3, vitamin E and zinc, each with a repletion dose. Borderline: coenzyme Q10, copper, glucose-insulin interaction, glutathione, manganese, selenium and vitamin K2. Spectrox total antioxidant function 50 and Immunidex total immune function 52, both in the average band.
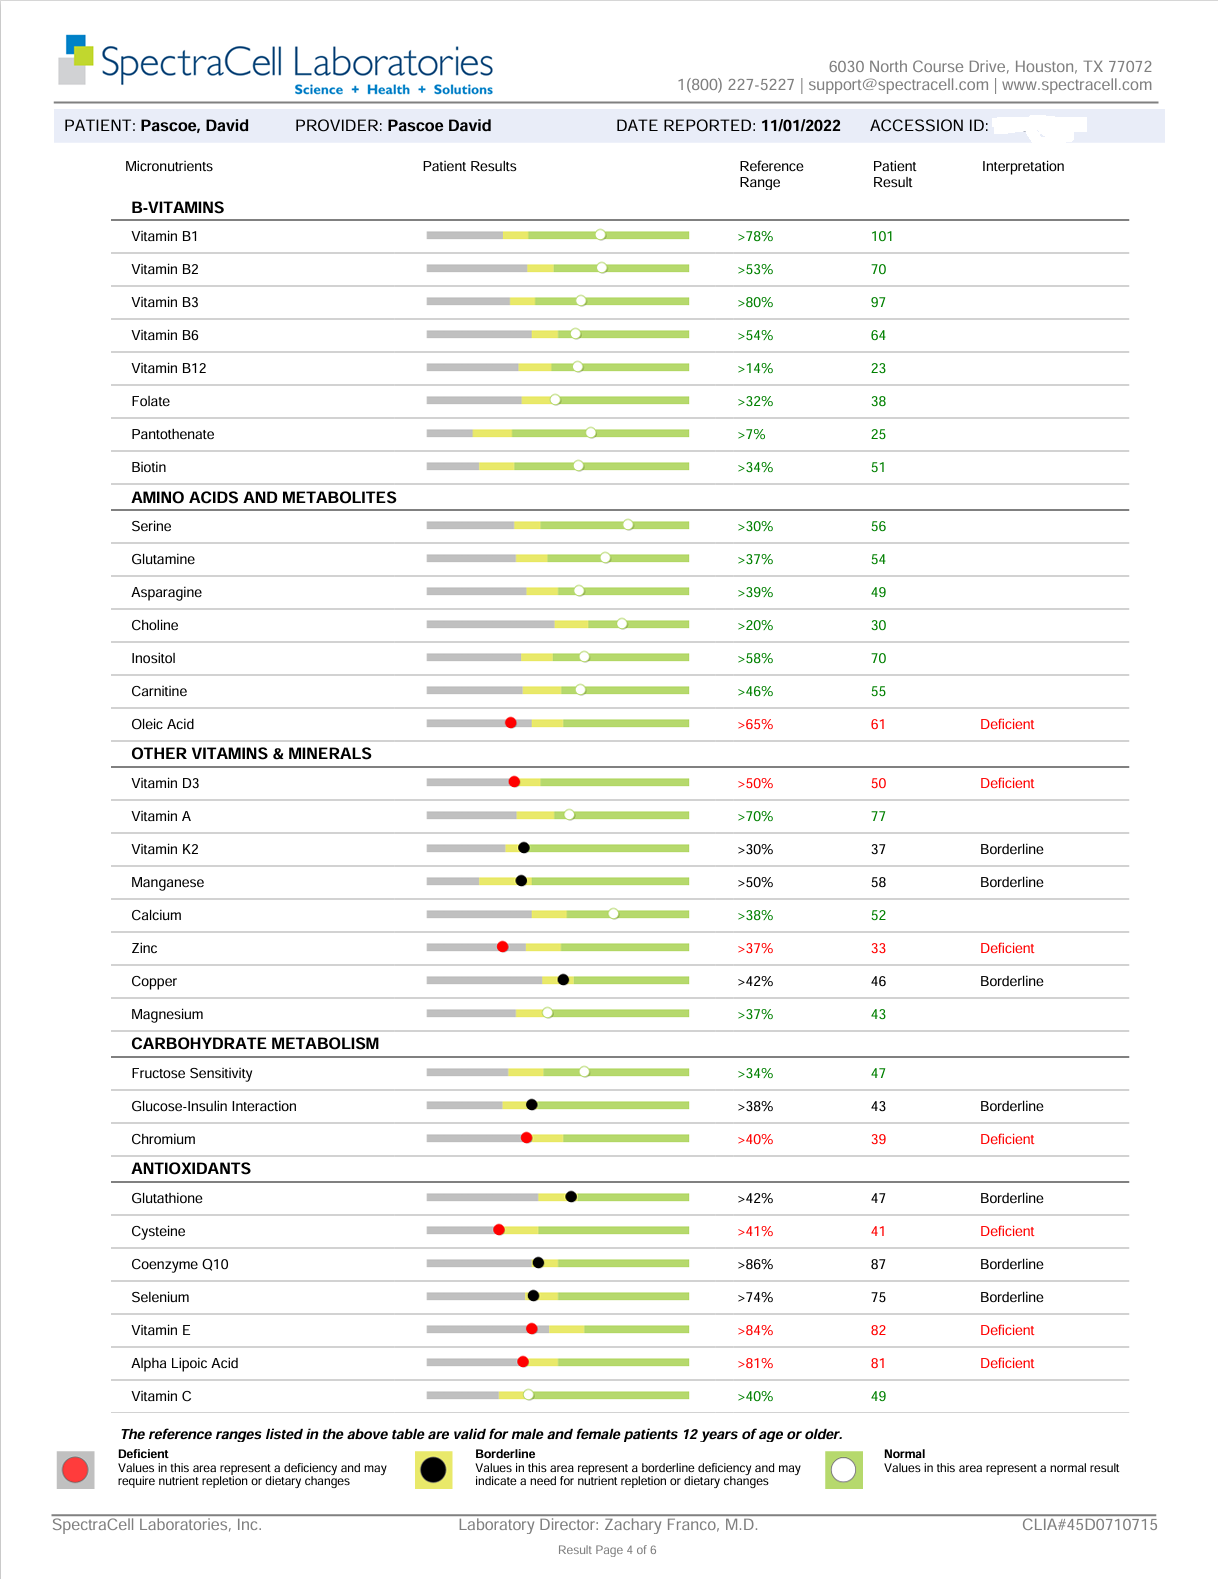
SpectraCell micronutrient table, reported 1 November 2022, listing each marker against its reference range. Deficient: oleic acid 61, vitamin D3 50, zinc 33, chromium 39, cysteine 41, vitamin E 82 and alpha lipoic acid 81. Borderline: vitamin K2 37, manganese 58, copper 46, glucose-insulin interaction 43, glutathione 47, coenzyme Q10 87 and selenium 75. The remaining B-vitamins, amino acids, minerals and vitamin C are normal.
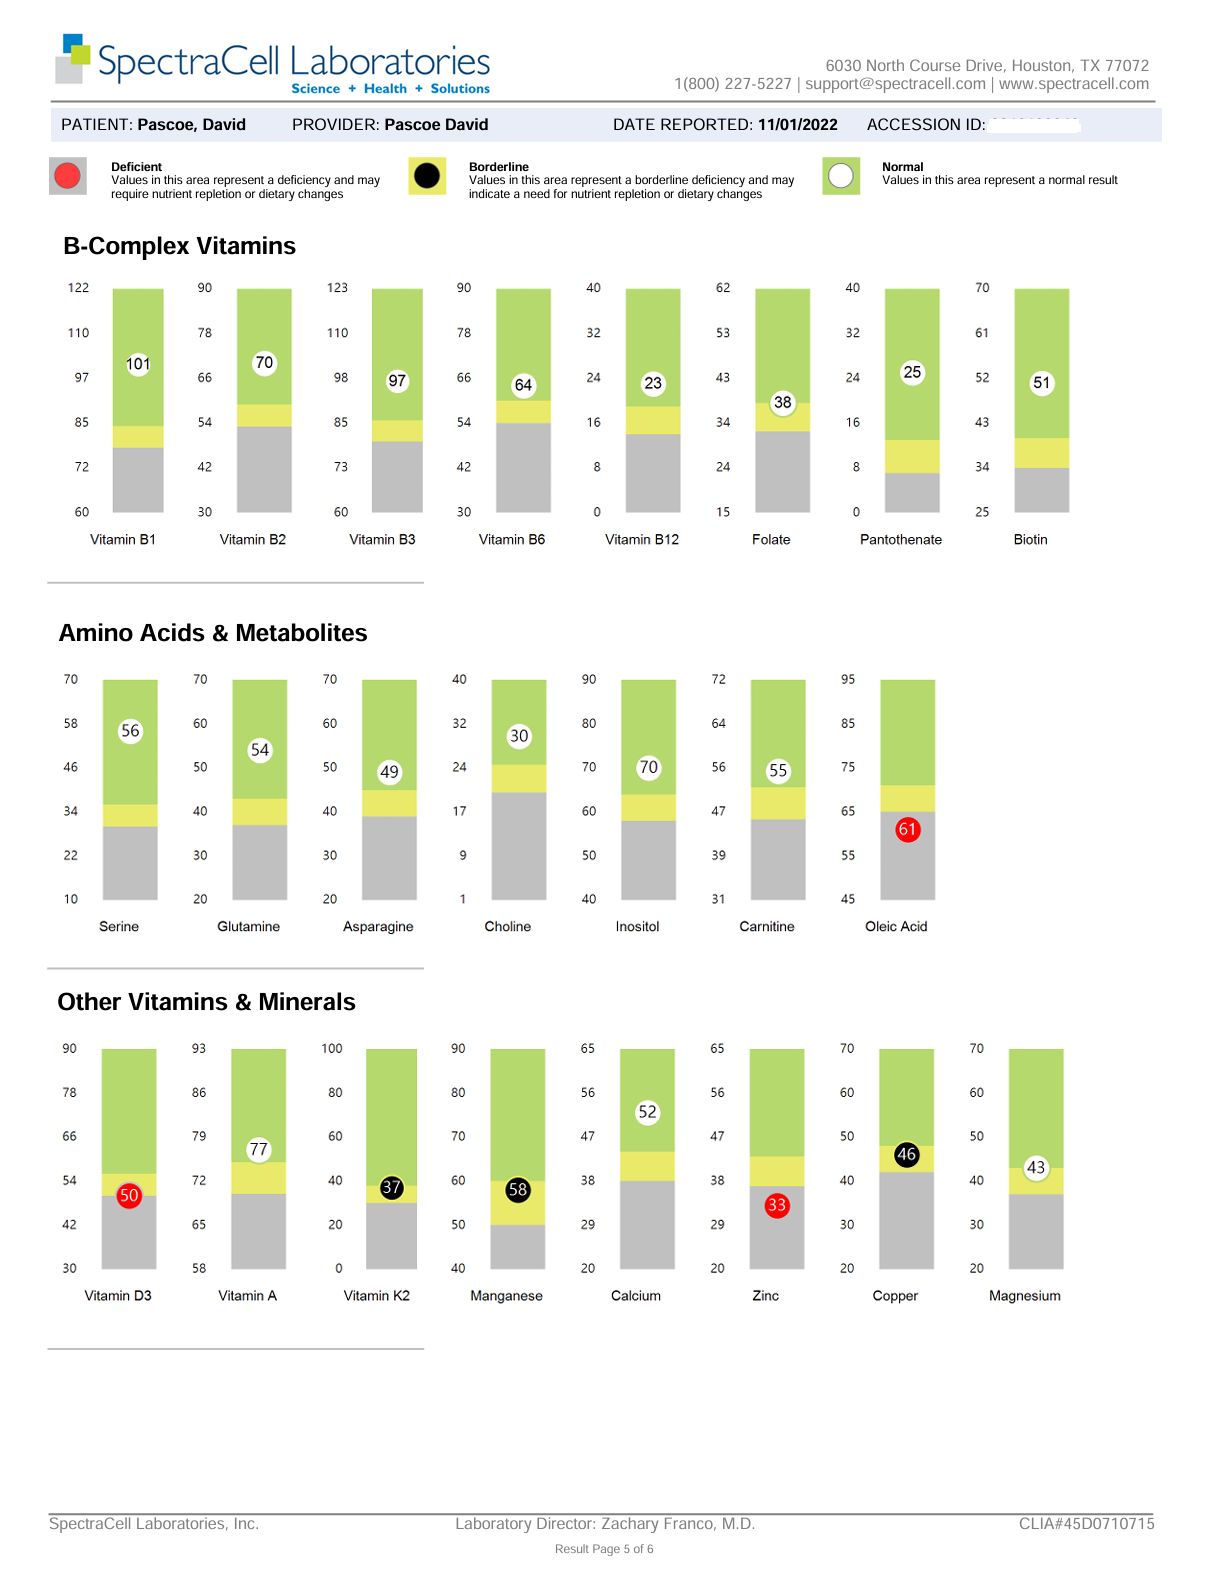
SpectraCell bar charts, reported 1 November 2022, for B-complex vitamins, amino acids and metabolites, and other vitamins and minerals. Vitamin D3 at 50, zinc at 33 and oleic acid at 61 are flagged deficient in red; vitamin K2 37, manganese 58 and copper 46 are borderline.
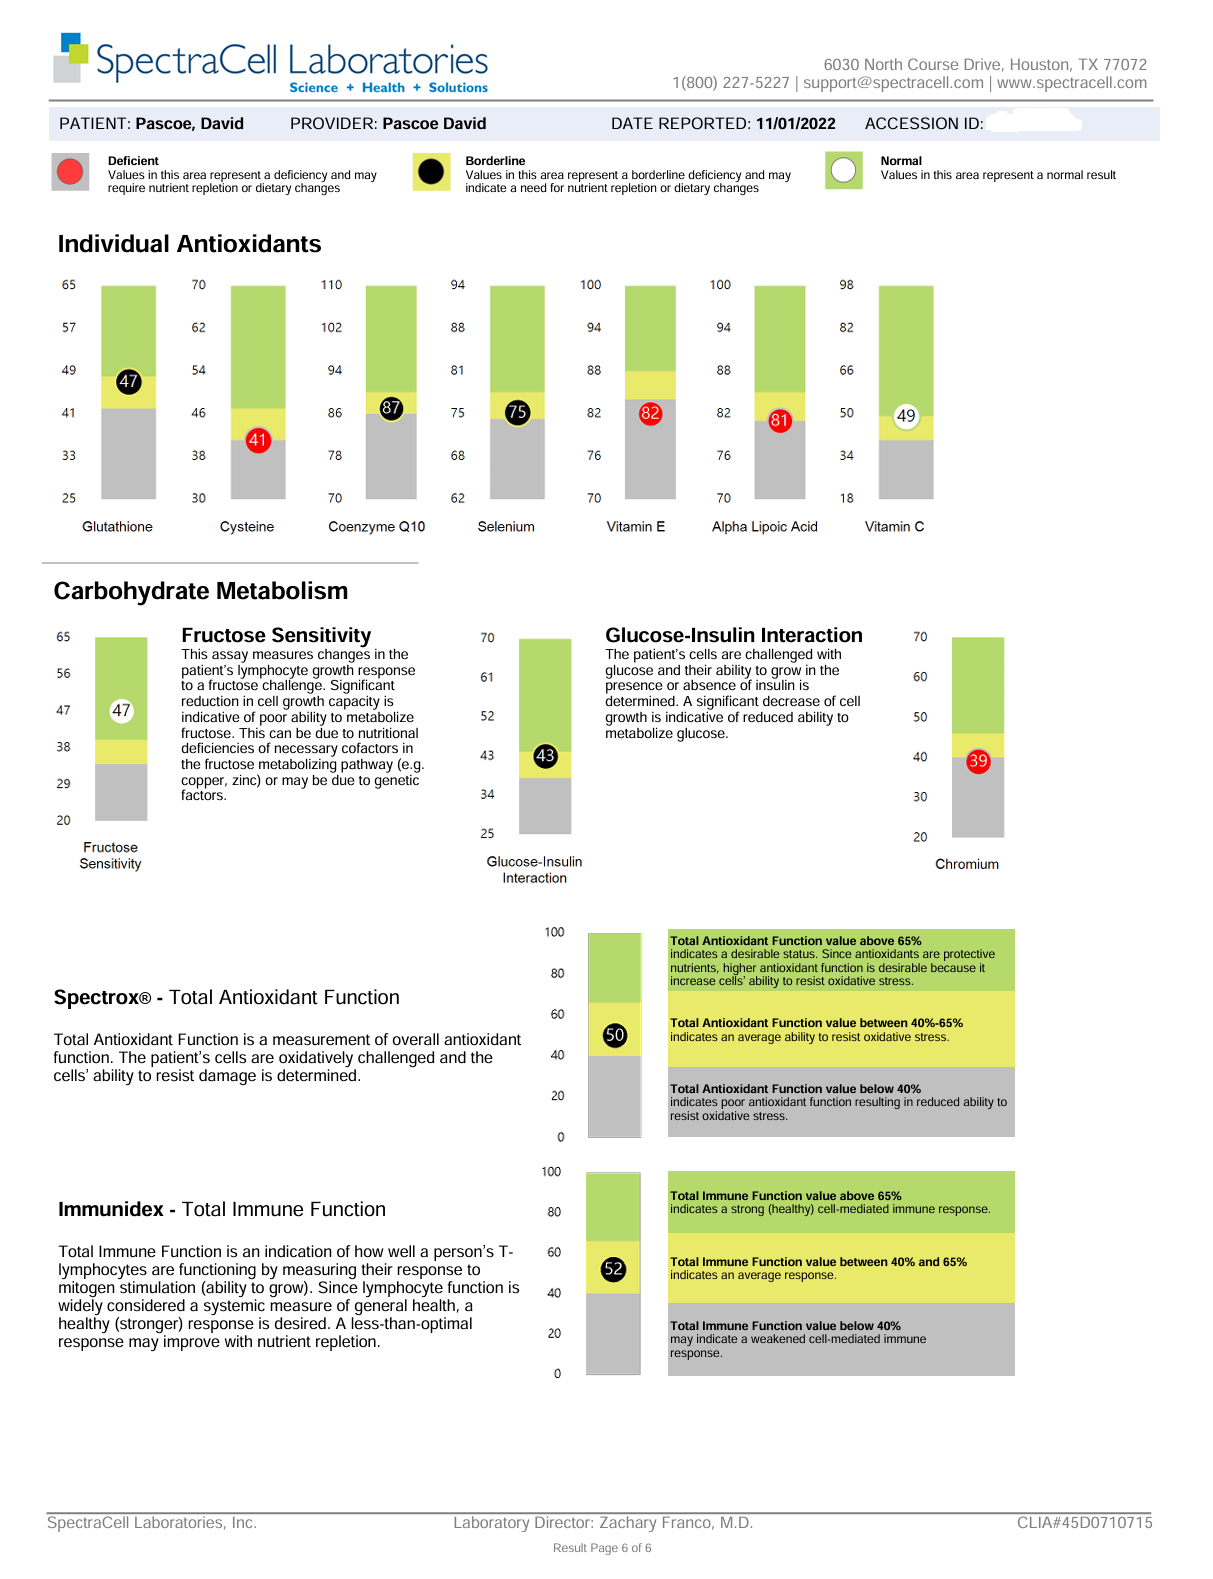
SpectraCell bar charts, reported 1 November 2022, for individual antioxidants and carbohydrate metabolism. Cysteine 41, vitamin E 82, alpha lipoic acid 81 and chromium 39 are deficient; glutathione 47, coenzyme Q10 87, selenium 75 and glucose-insulin interaction 43 are borderline. Spectrox 50 and Immunidex 52.
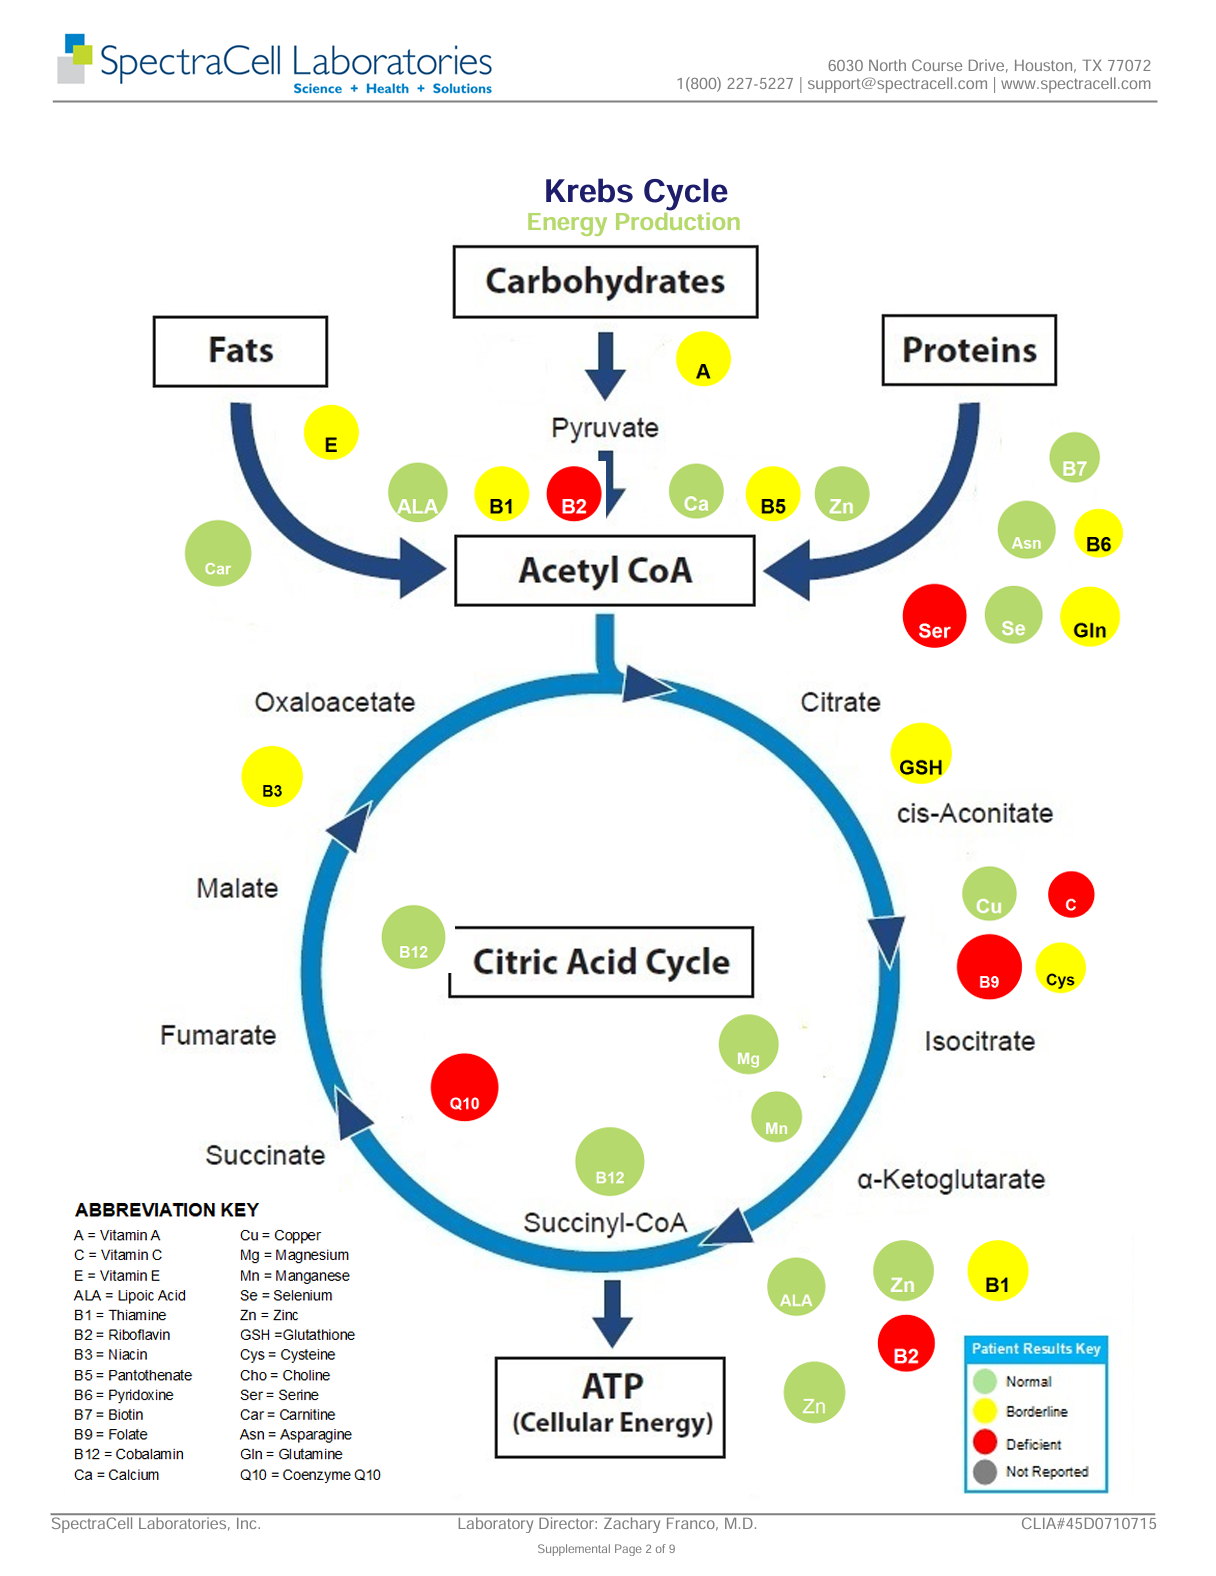
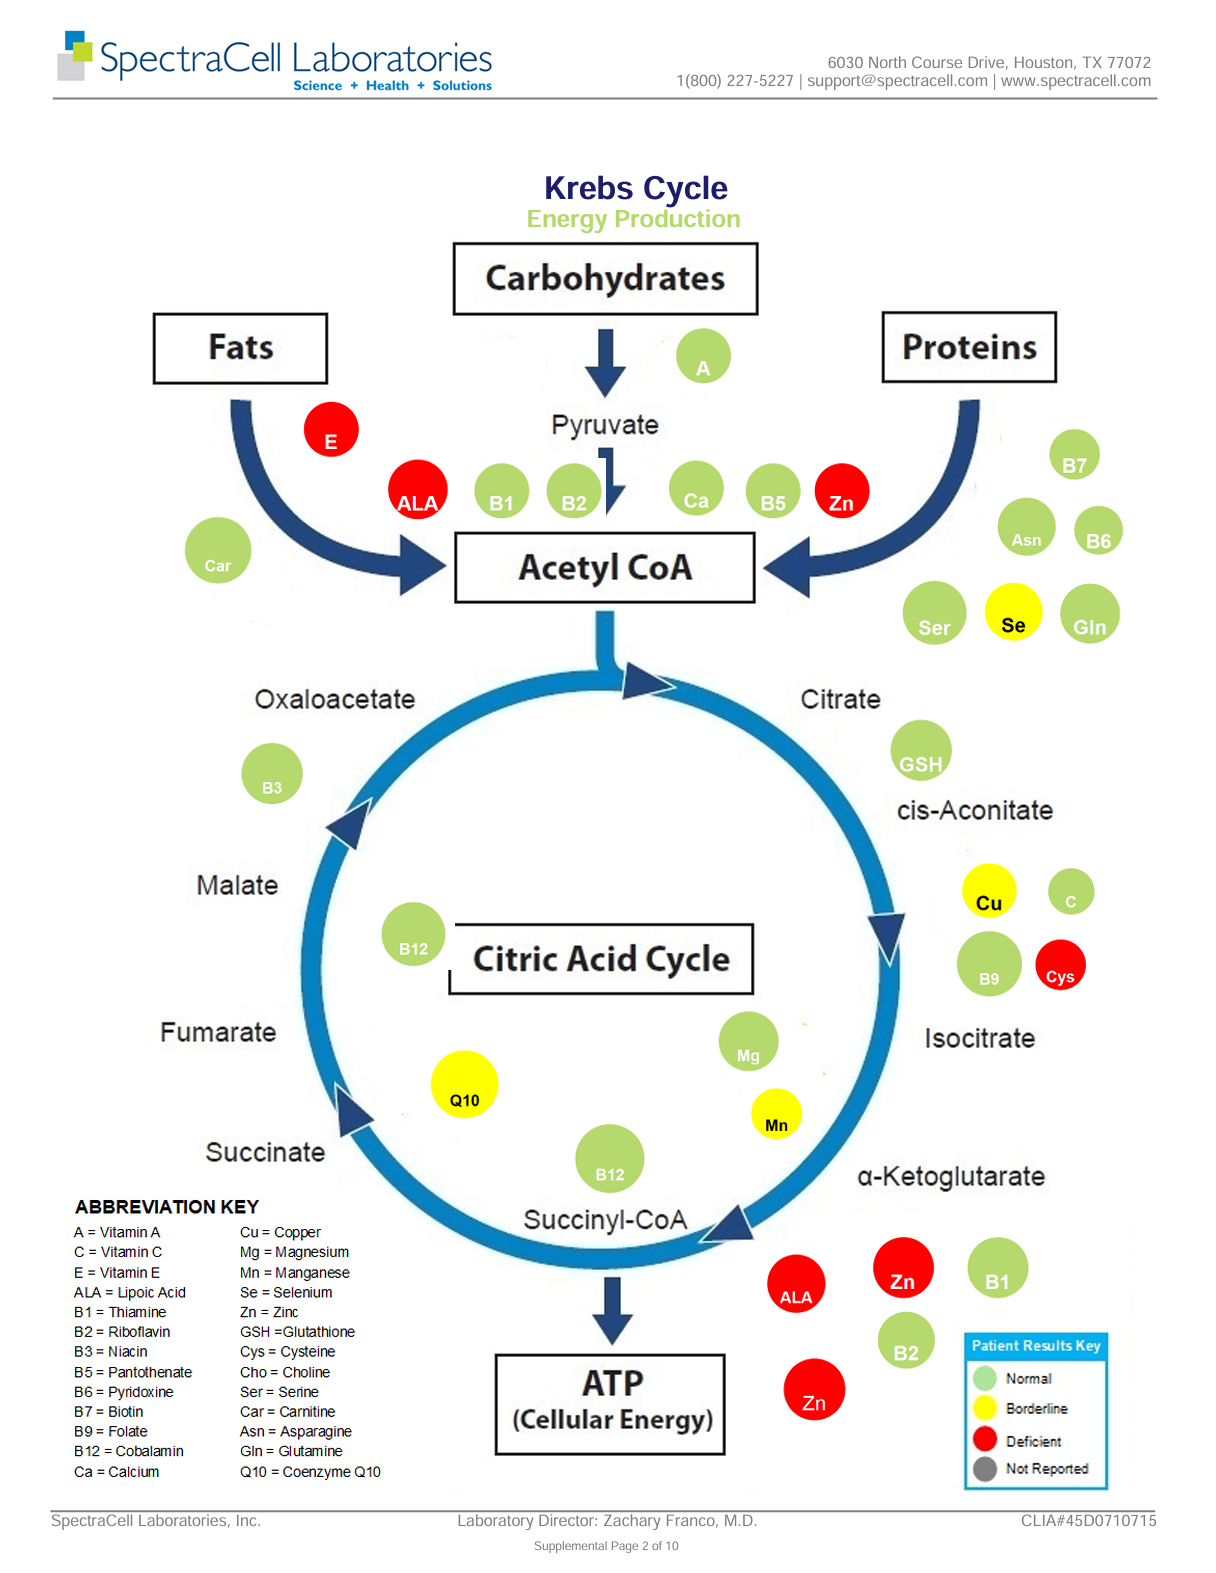
SpectraCell Krebs cycle diagram, reported 1 November 2022, mapping each nutrient onto the pathway from carbohydrates, fats and proteins through acetyl-CoA and the citric acid cycle to ATP, with every cofactor coloured by result. Vitamin E, alpha lipoic acid, zinc and cysteine show red (deficient); selenium, copper, coenzyme Q10 and manganese show yellow (borderline).
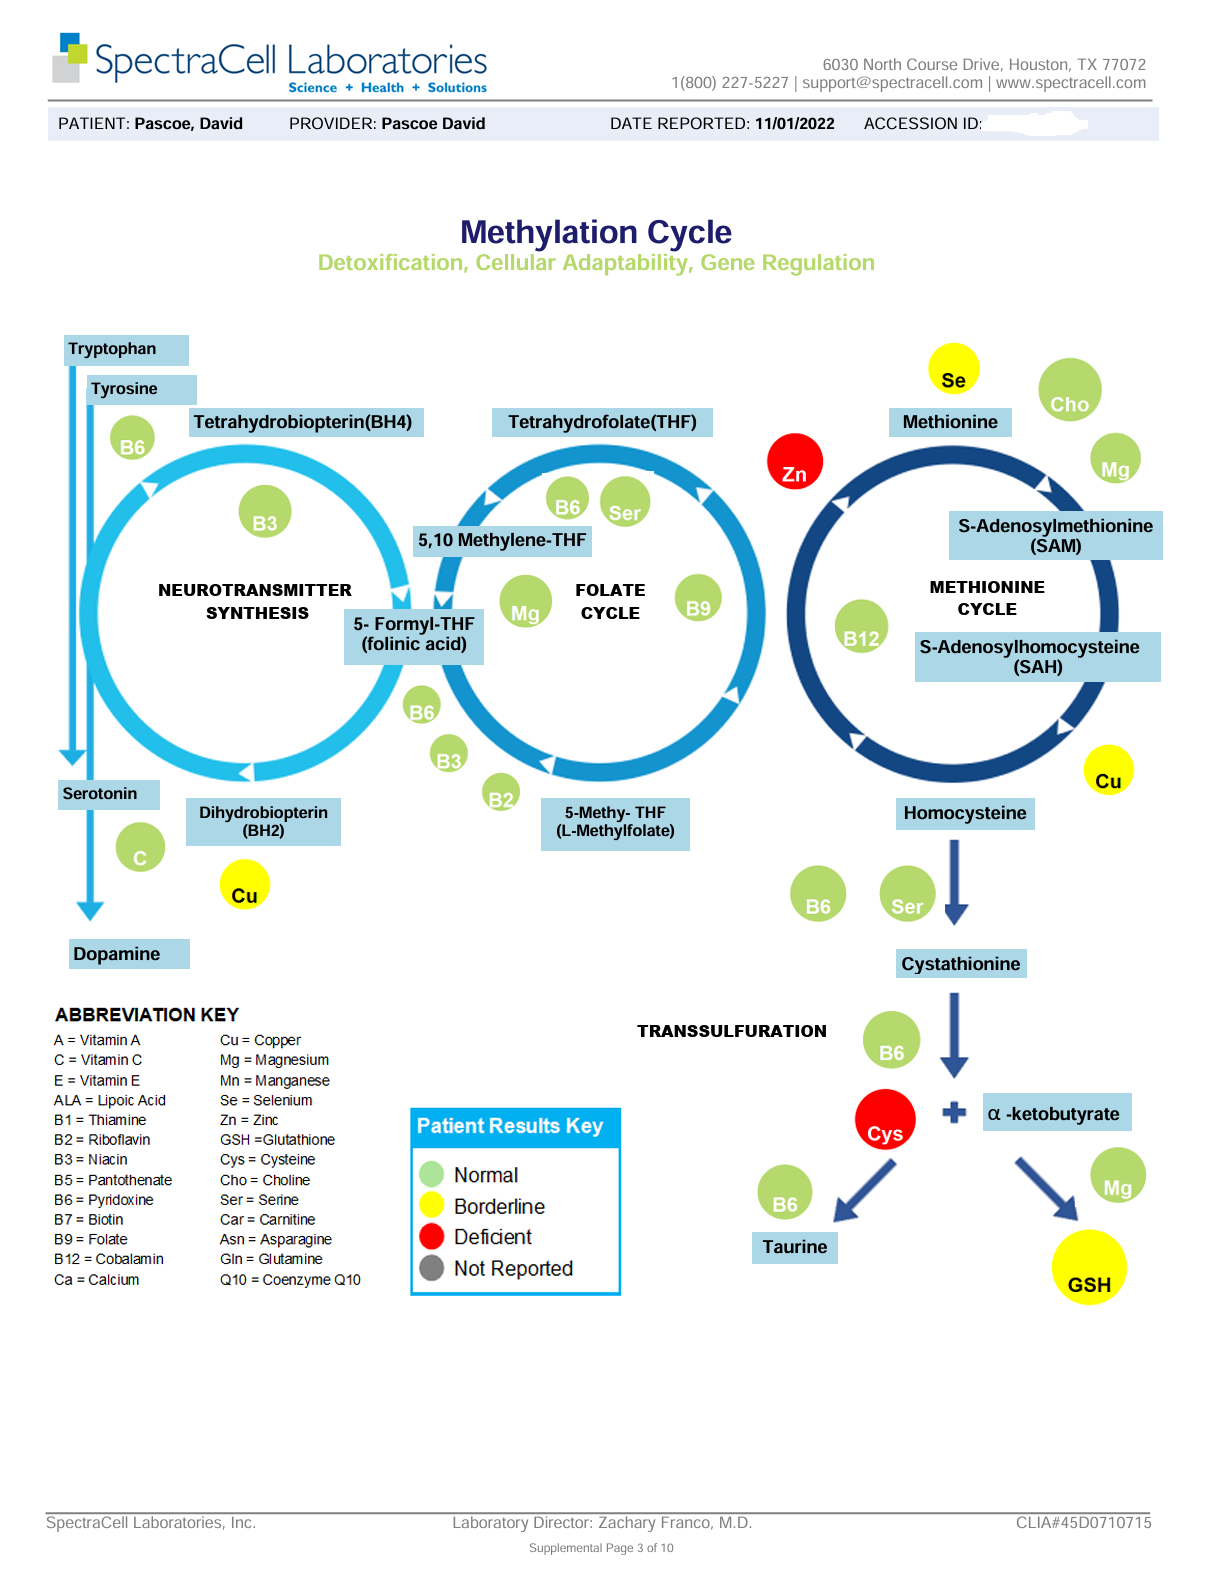
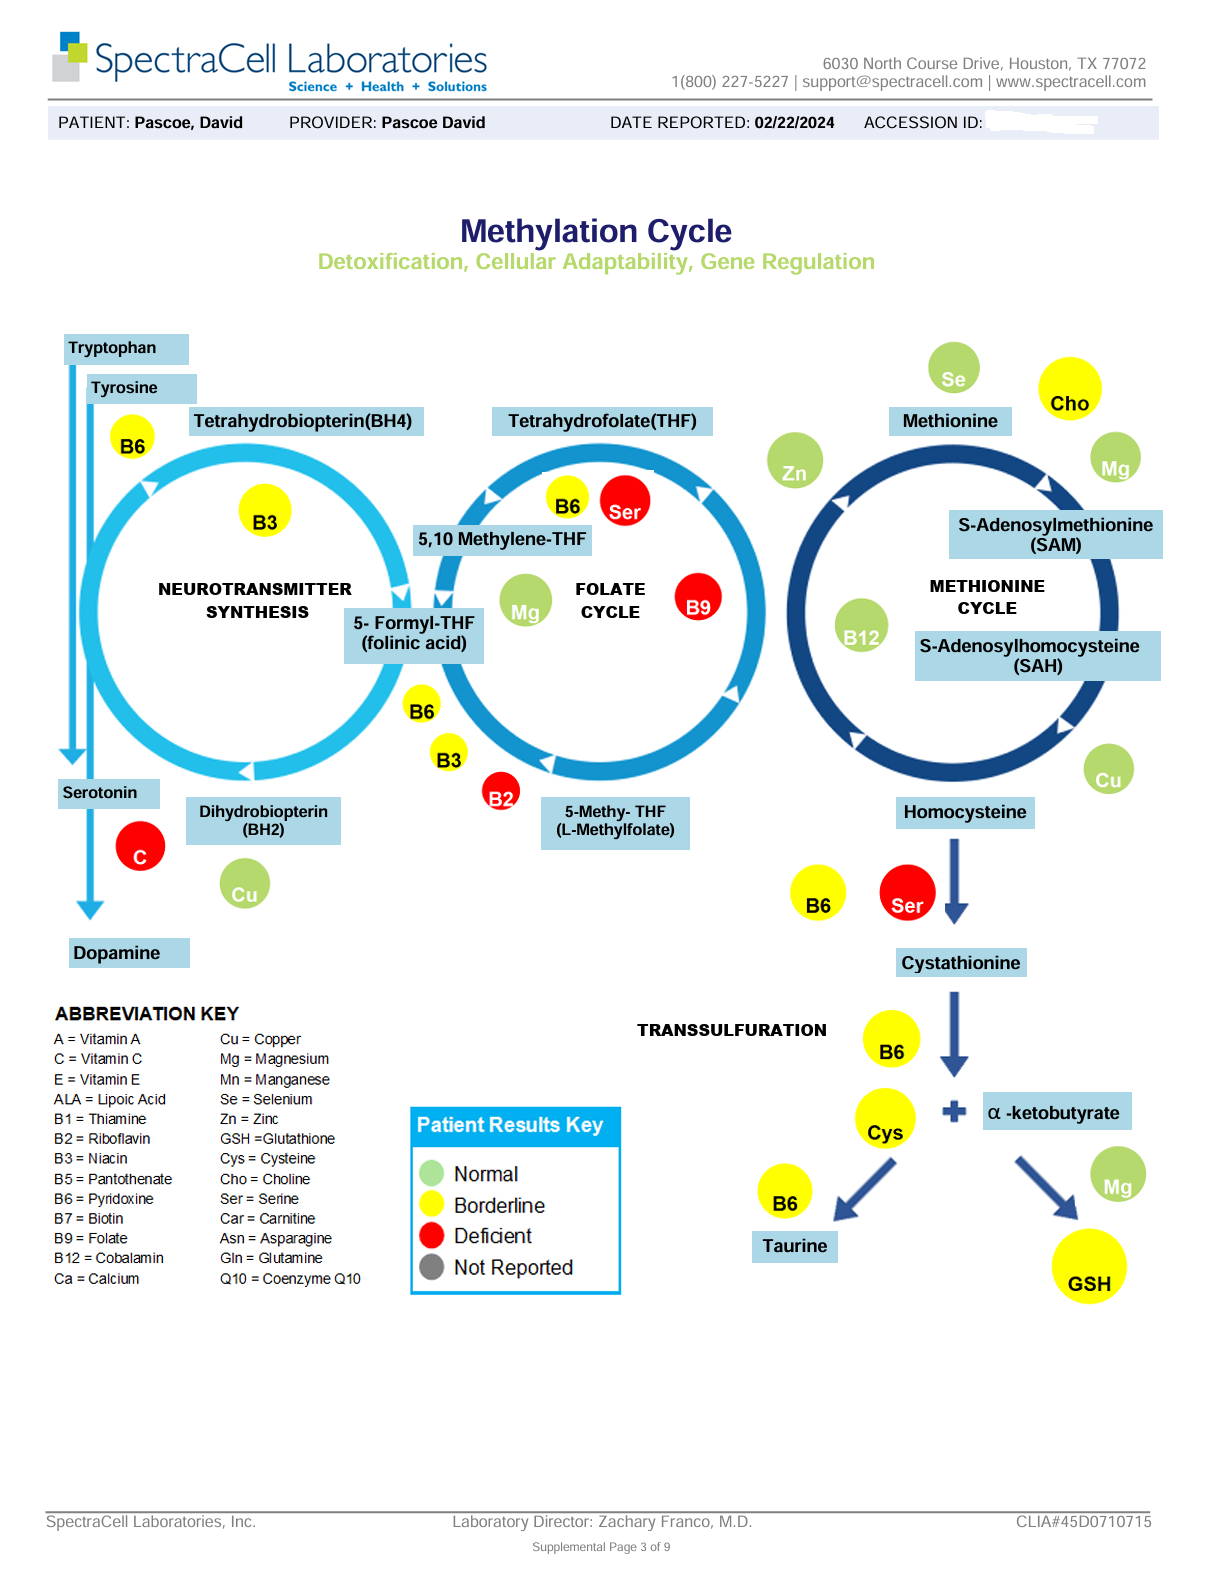
SpectraCell methylation cycle diagram, reported 1 November 2022, showing neurotransmitter synthesis, the folate cycle, the methionine cycle and transsulfuration with each cofactor coloured by result. Zinc and cysteine show red (deficient); selenium, copper and glutathione show yellow (borderline).

February 2024

In the months prior to this test, I began to notice that my energy level was off. It was once again taking me two hours to complete a standard one hour P90X workout.

Many years ago, I had encountered the same thing, but I mistakenly wrote it off to "something that just happens as we age". But when I began taking an NAD booster (in this case, TruNiagen NR), I found all of my lost energy and then some!

When my energy began to dissipate this time, I'd just assumed that my current intake of NR was no longer sufficient for my needs. However, when I took an NAD test, it showed me that was not the case! My NAD levels were just fine! So I was a bit puzzled as to the cause, until this SpectraCell Micronutrients test's results came back.

Just look at what it found!

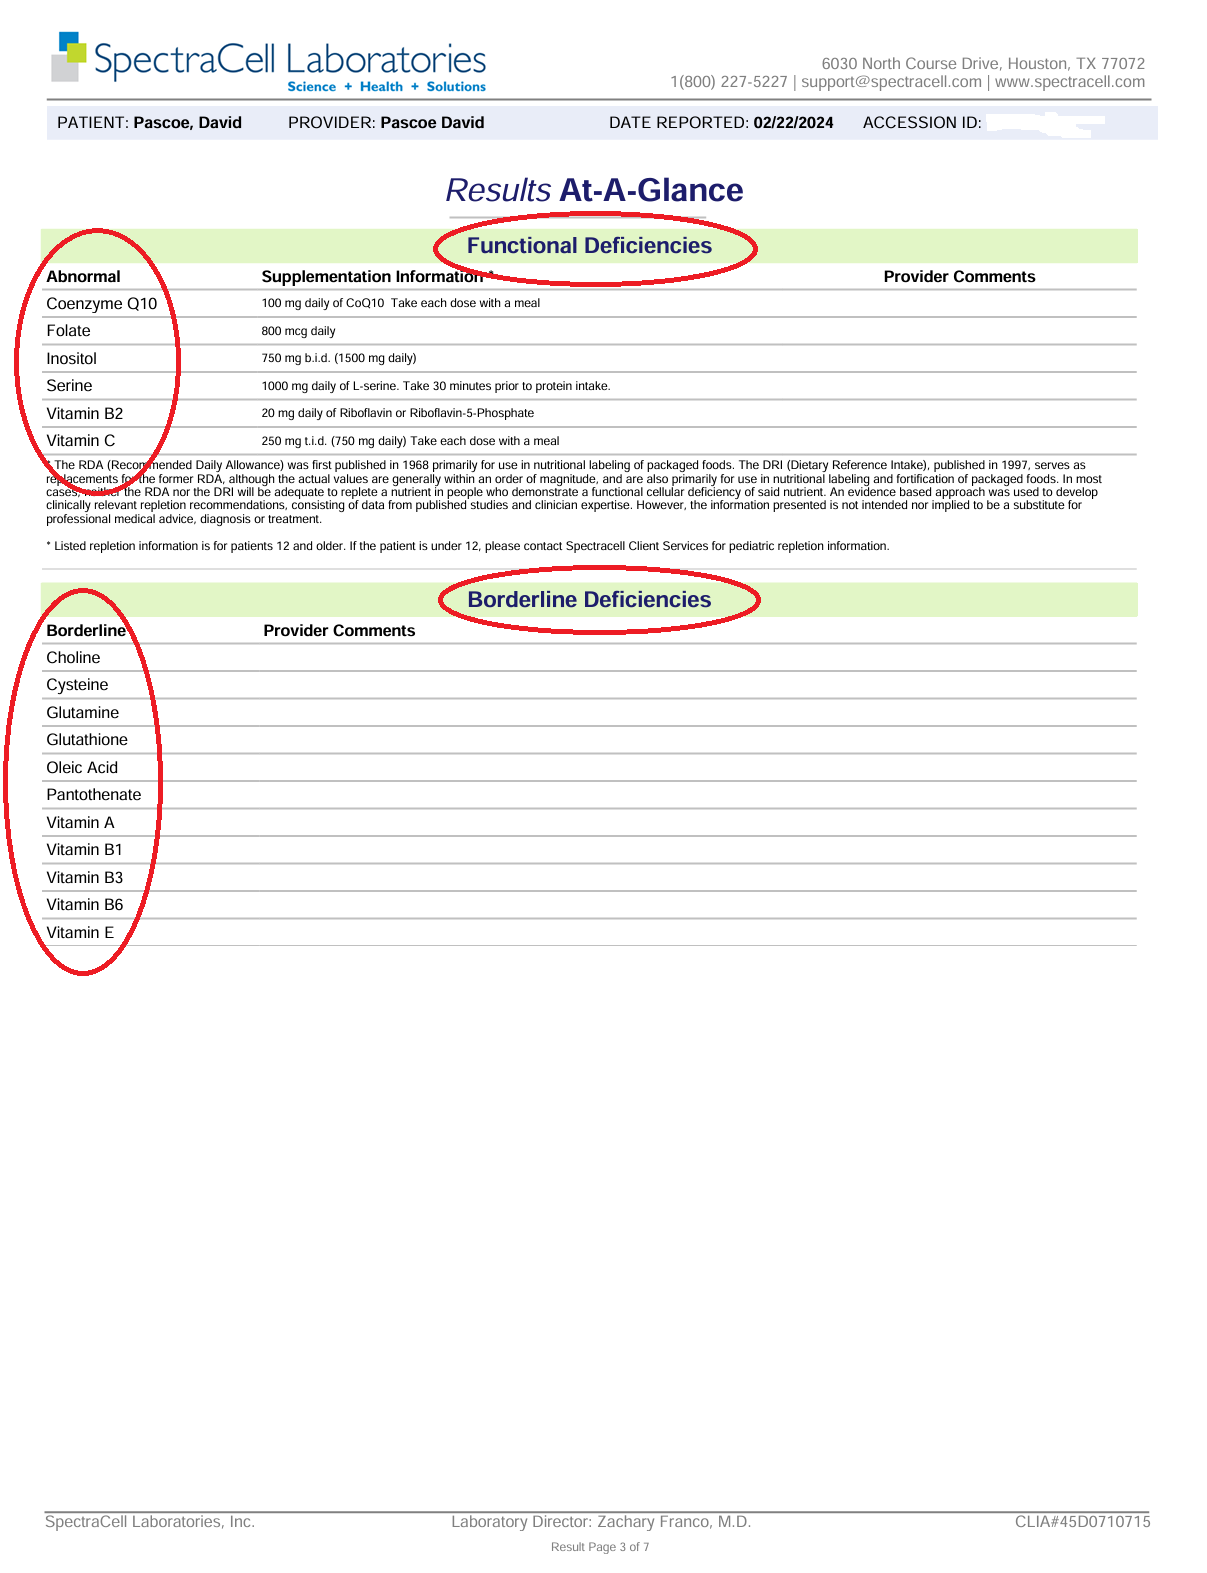
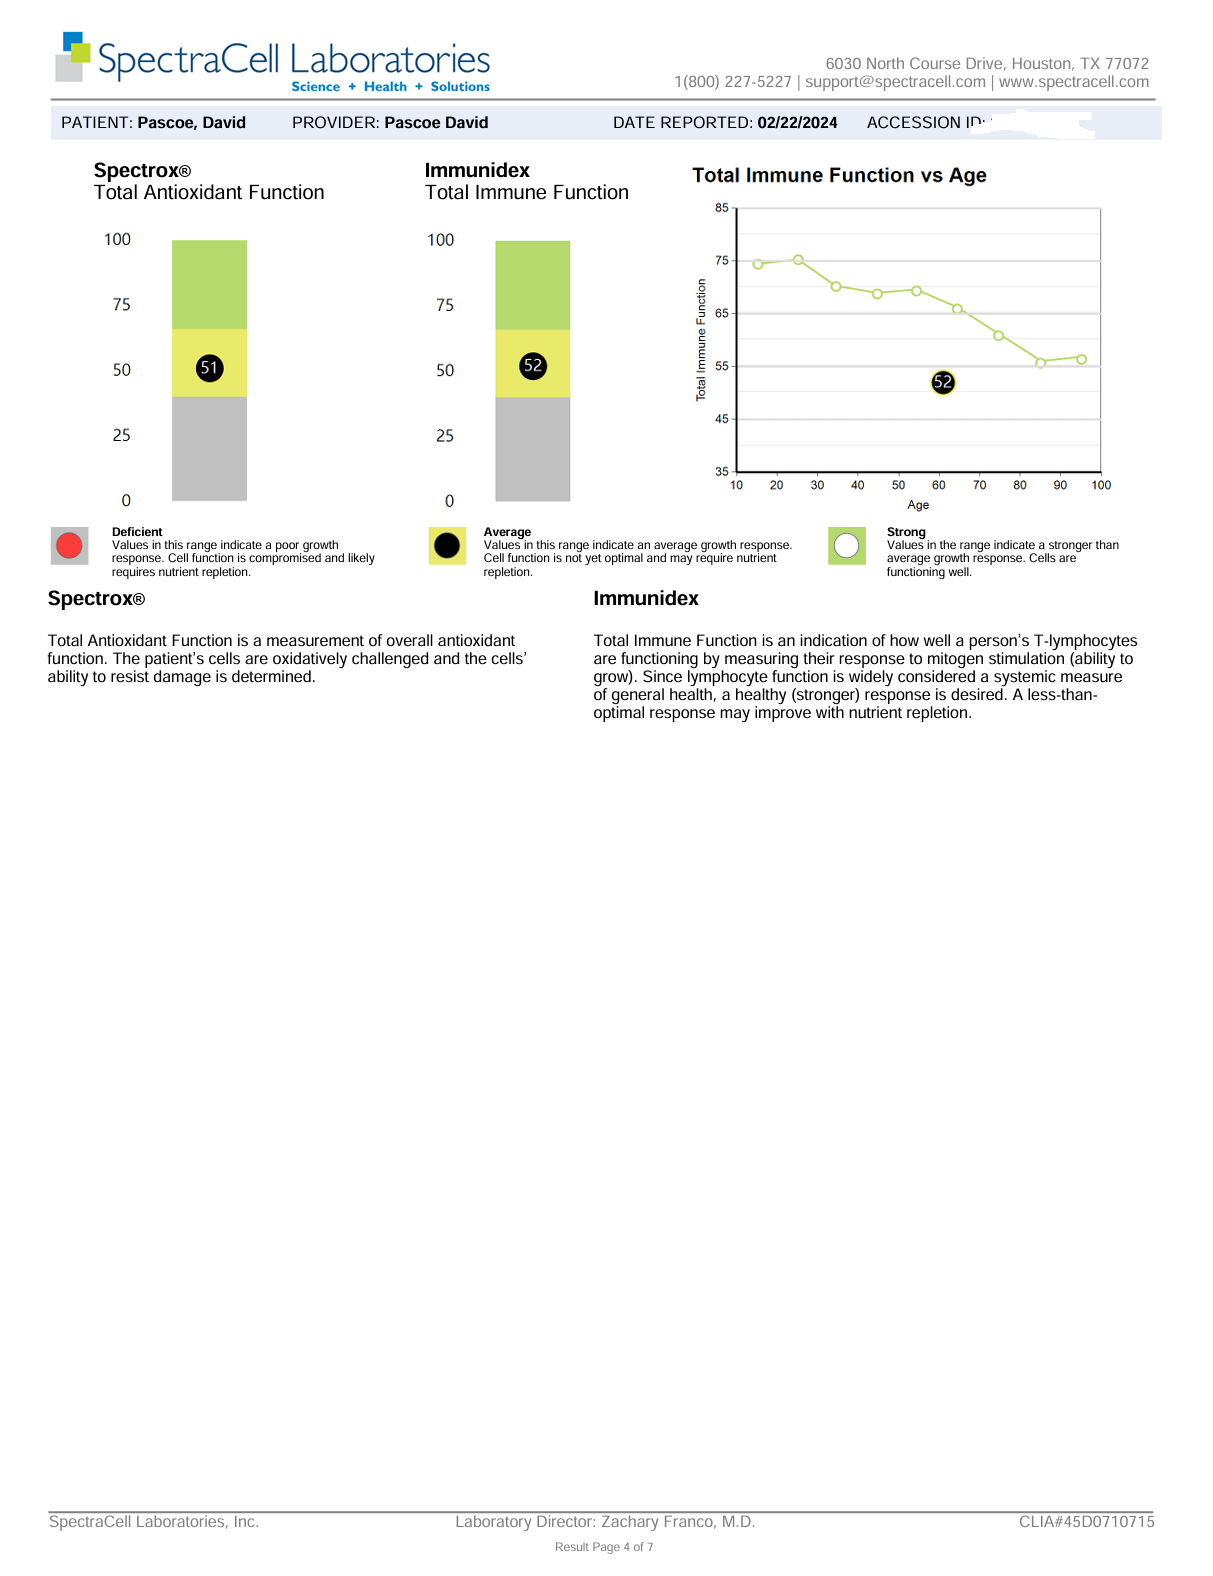
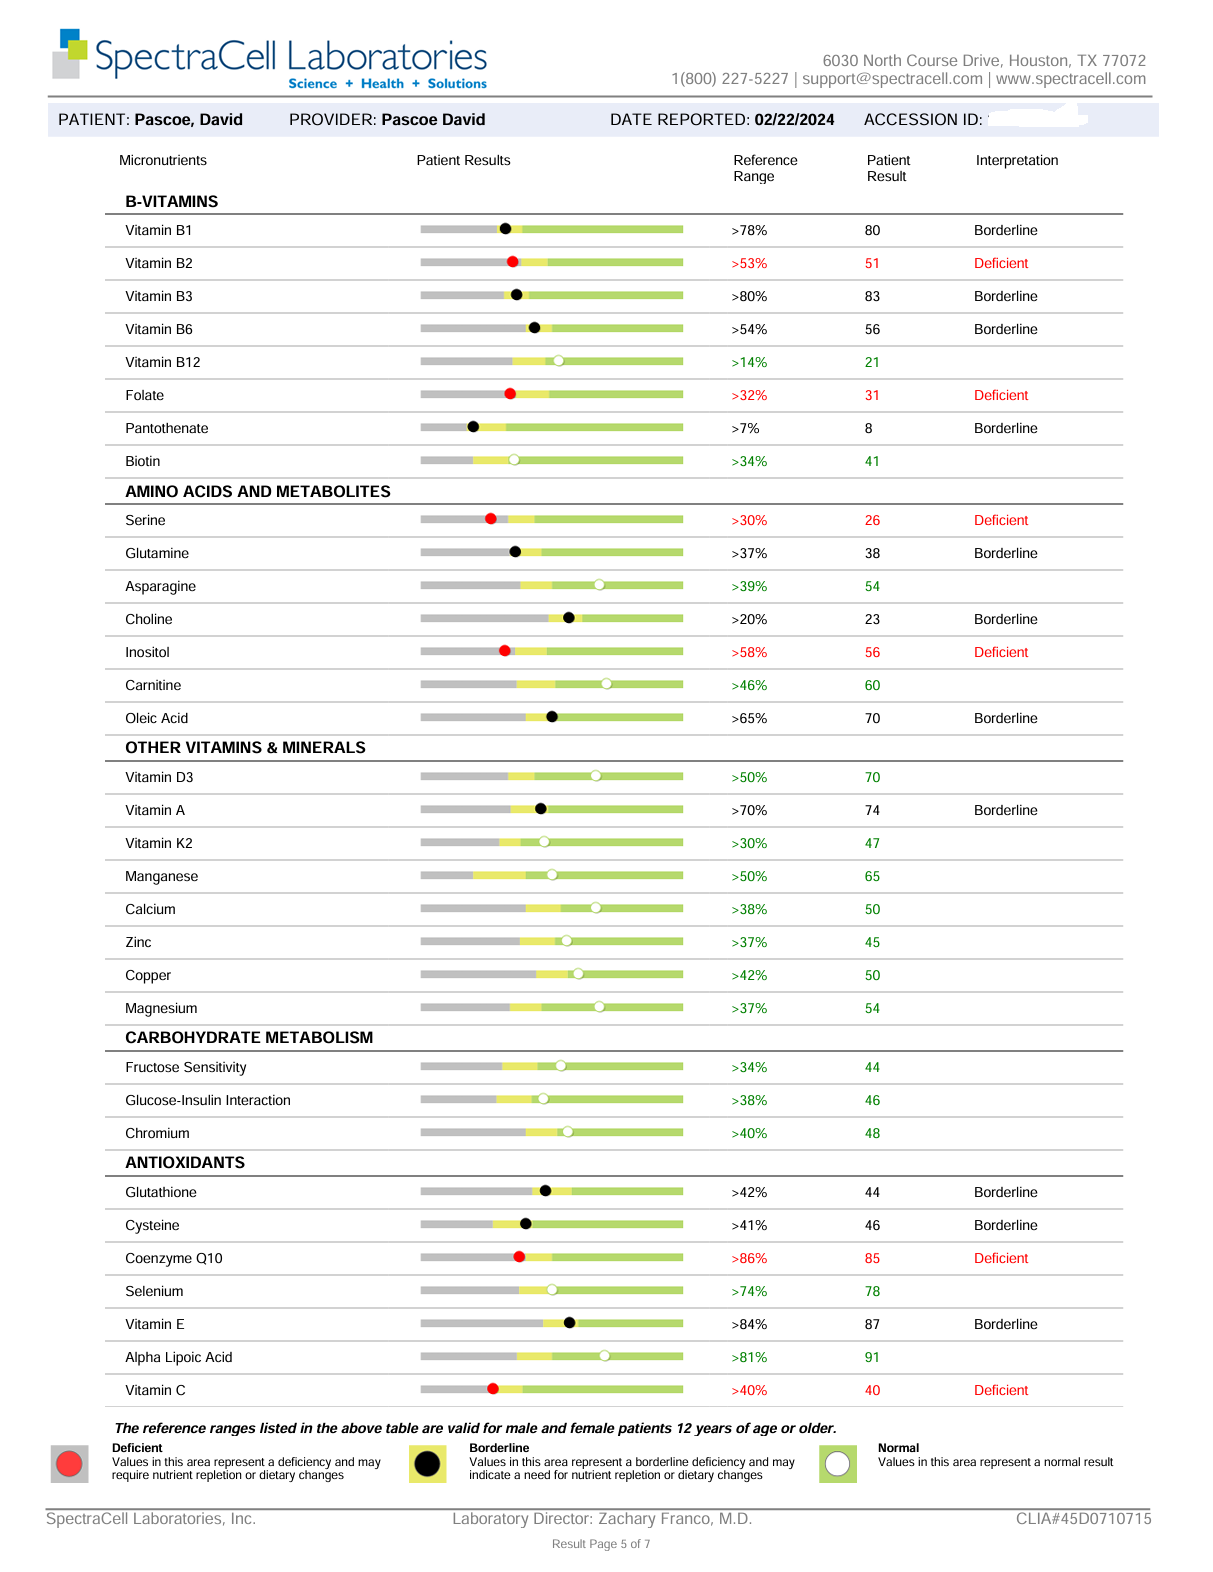
SpectraCell results at a glance for David Pascoe, reported 22 February 2024. Functional deficiencies: coenzyme Q10, folate, inositol, serine, vitamin B2 and vitamin C, each with a repletion dose. Borderline: choline, cysteine, glutamine, glutathione, oleic acid, pantothenate, vitamin A, vitamin B1, vitamin B3, vitamin B6 and vitamin E.
SpectraCell Spectrox and Immunidex summary, reported 22 February 2024 — total antioxidant function 51 and total immune function 52, both in the average band.
SpectraCell micronutrient table, reported 22 February 2024. Deficient: vitamin B2 51, folate 31, serine 26, inositol 56, coenzyme Q10 85 and vitamin C 40. Borderline: vitamin B1 80, vitamin B3 83, vitamin B6 56, pantothenate 8, glutamine 38, choline 23, oleic acid 70, vitamin A 74, glutathione 44, cysteine 46 and vitamin E 87. Vitamin D3 70, zinc 45, magnesium 54 and the remaining markers are normal.
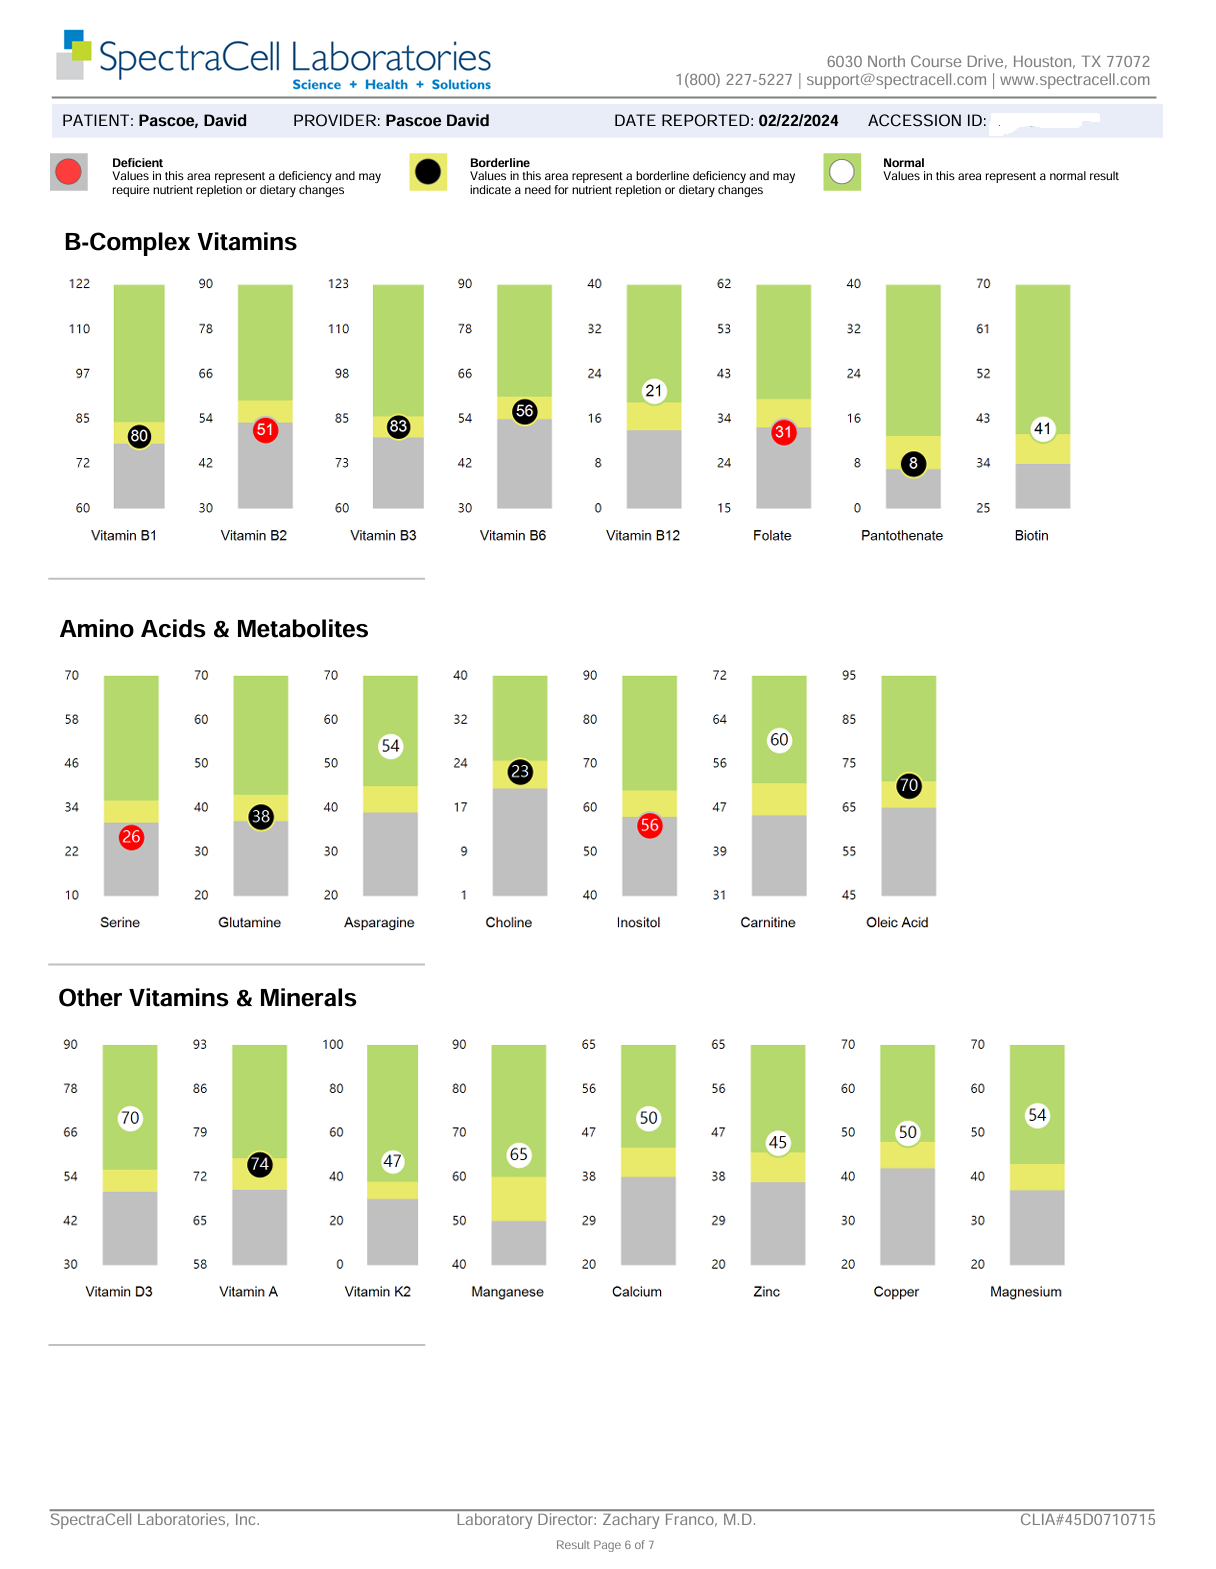
SpectraCell bar charts, reported 22 February 2024, for B-complex vitamins, amino acids and metabolites, and other vitamins and minerals. Vitamin B2 51, folate 31, serine 26 and inositol 56 are flagged deficient in red; vitamin B1 80, vitamin B3 83, vitamin B6 56, pantothenate 8, glutamine 38, choline 23, oleic acid 70 and vitamin A 74 are borderline.
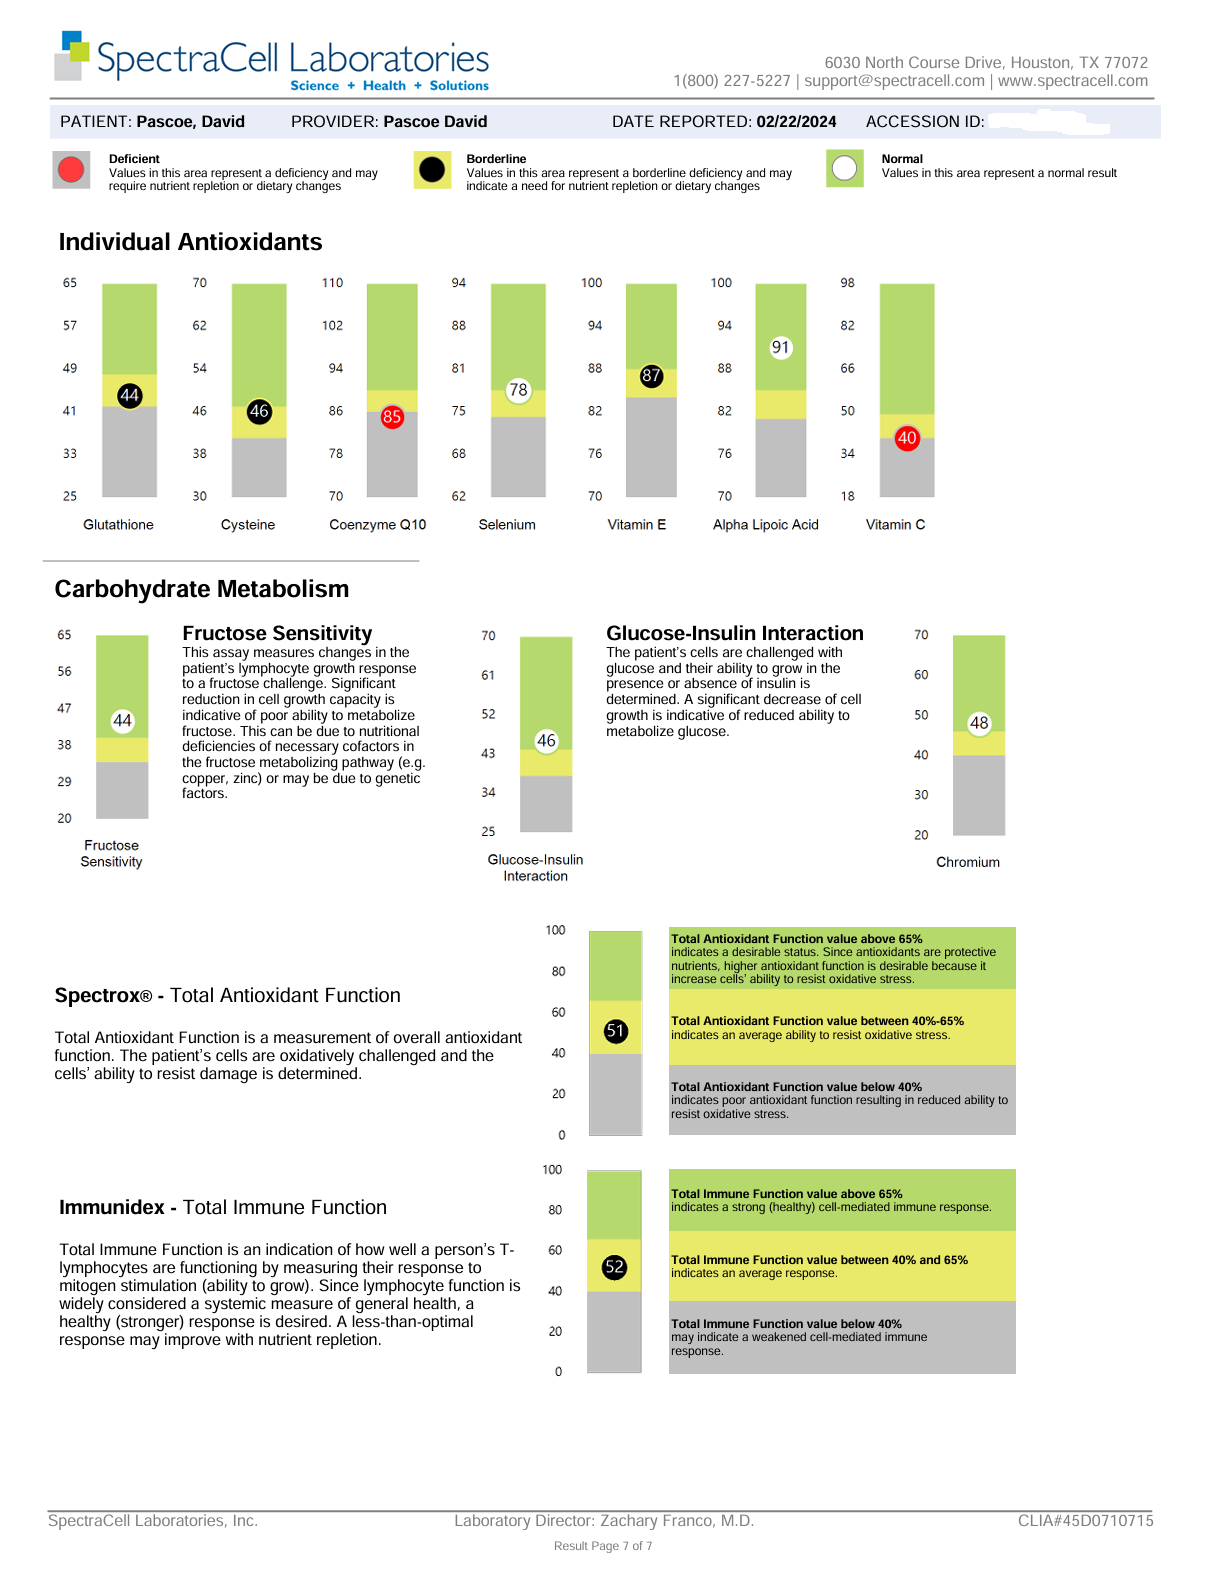
SpectraCell bar charts, reported 22 February 2024, for individual antioxidants and carbohydrate metabolism. Coenzyme Q10 85 and vitamin C 40 are deficient; glutathione 44, cysteine 46 and vitamin E 87 are borderline. Spectrox 51 and Immunidex 52.
SpectraCell Krebs cycle diagram, reported 22 February 2024, mapping each nutrient onto energy production with every cofactor coloured by result. Vitamin B2, serine, vitamin C, folate and coenzyme Q10 show red (deficient); vitamin A, vitamin E, B1, B5, B6, glutamine, glutathione, B3 and cysteine show yellow (borderline).
SpectraCell methylation cycle diagram, reported 22 February 2024, showing neurotransmitter synthesis, the folate and methionine cycles and transsulfuration with each cofactor coloured by result. Serine, folate, vitamin B2 and vitamin C show red (deficient); B6, B3, choline, glutathione and cysteine show yellow (borderline).

Needless to say, I was shocked! How in the heck could I be deficient in things that I know I am already supplementing quite well???

My very first though was "They must have changed the formulation of one of my supplements and removed all of the B vitamins!!" I don't like taking formulations, just for this very potential reason! But that didn't explain the deficiency in CoQ10, Cysteine, or Glutathione.

A quick check of my Life Extension Two Per Day multivitamin supplement bottle revealed that the contained B vitamins had not changed - they were still there! So my very next thought was that I must have something in my diet or supplementation that is interfering with my absorption of those B vitamins, CoQ10, Cysteine, and subsequent production of Glutathione, and I immediately knew what that something was. I had encountered it once before when I had experienced low ferritin measures -- it was the various teas in my morning Lemon Tea!

My tea brew used to be admittedly quite strong! I figured if a little was good, a lot must be better, right? Ha! Wrong! I had been brewing it so strong that it was impacting my ability to store iron in the form of ferritin. When I cut it back to half strength, that issue resolved, so I thought I was good. But I didn't realize it's continued impact upon other micronutrients, and I was taking all of my morning supplements with my morning Lemon Tea!

Polyphenols, such as tannins, gallic acid, and ellagitannins, are found in various foods and beverages, particularly in coffee, tea, and red wine. These compounds have been shown to bind to and inhibit the absorption of iron, zinc, CoQ10, and some B vitamins, such as niacin, thiamin, and pyridoxine, potentially leading to reduced bioavailability and subsequent deficiencies. And my situation was a very classic example!

I could have changed the timing of when I take my supplements to space them out away from my morning tea, but instead I've opted to just eliminate the tea bags completely from my morning Lemon "tea" and finish moving all of my other polyphenol-containing supplements into the late evening where:

a) they won't interfere with those other supplements' absorption, and

b) they are better placed for their AMPK and autophagy-inducing effects anyway. I had attempted a complete move of them to the evenings previously, but had never finished that effort. This was finally the impetus I needed to get off my butt and get it done. My supplements listing has now since been updated to reflect this change.

Since making this change, I've already noticed the increase to my energy and stamina that I had gradually begun to notice waning before.

I wonder how many other people take their multivitamin with their morning coffee and are unwittingly negating their multivitamin's effect?

It just goes to show that you'd have absolutely no way of knowing that these things were happening, without doing some sort of consistent testing to ensure that you're continuing to remain on track!

It also surprises me to note that I can have a measurably slower pace of aging and yet stillbe deficient in several basic nutrients! Wow!!

Needless to say, now that I've corrected this mistake, I will be taking another SpectraCell Micronutrients Analysis in another month or so, just to validate that everything has returned to normal, and I will consider increasing my dosages of anything that remains near borderline (if applicable) or towards the lower end of normal.

Beyond the basics

The rest of my panel

Whole-body data most people never collect — here's what it actually shows.

Sleep

Sleep study — mild, mostly positional

A full overnight lab study found mild, mostly position- and REM-related sleep apnea — almost no true obstructive events — with excellent sleep efficiency (89.9%) and an athlete's resting heart rate of 54 bpm. A later at-home test ran higher, so I'm tracking it.

Onera PSG 2025-08: AHI 5.2 (REM 15.5, supine 15.5; obstructive-apnea index 0.1) · arousal 22.4/hr · TST 8h32m · SpO₂ nadir 80% · ApneaLink 2026-01 AHI 14.85
Reversed

Hormones — a deliberate androgen rebound

My "Hormone Age" was the single fastest-aging thing about me. I acted — and in 3.5 months my key androgens came roaring back, without any estrogen-raising agents.

DUTCH 2025-08 → 2025-11: DHEA-S 49.9 → 710.8 ng/mg (+1320%) · testosterone 28.97 → 56.52 (+95%) · estradiol 0.85 → 0.72 (stable)
Acting on it

Micronutrients — the one real gap

An intracellular micronutrient panel (it measures function inside the cell, not just blood levels) flagged a functional B12 deficiency that fell across three tests, plus low selenium — so I'm repleting both and re-testing. (The B12 result clinically confirms my genetic MTRR signal.)

SpectraCell functional B12: 23% → 21% → 8% (deficient by 2024-09; threshold >14%) · selenium → deficient
Metabolism & fitness

A fast engine

My resting metabolism burns faster than others my size, and my aerobic fitness (VO₂max) is solid for my age.

RMR 2026-01: 2,443 kcal/day (above predicted) · VO₂max 2026-01: 36.6 mL/kg/min
Cellular

NAD⁺ — the data changed my protocol

I measure my intracellular NAD⁺ directly — and it caught something: it was declining despite years on NR. That exactly matches my genetic NMRK1 bottleneck (genomics), so I'm switching NR → NMN (which bypasses it) and re-measuring. Test, don't guess — in action.

Jinfiniti icNAD: 47.6 μM (2023) → 33.7 μM (2025), suboptimal · cross-validates NMRK1 low-expression (34/49 tissues)
Gut

Gut microbiome

A stool microbiome panel scores my gut's diversity & balance — the foundation for immunity, mood, and how well I absorb everything else I take.

Gut Microbiome Report · Rych Index diversity score
Watching

An early heart-stiffness signal

My pumping function is normal, but a 2021 echo showed subtle early stiffening in how my heart relaxes between beats — a "watch this," not disease. I'm due for a repeat echo to track it.

Echo 2021-04: LVEF 60% (normal) · E/E′ ~16 (subclinical diastolic dysfunction) · repeat echo due 2026
Immune

Immune age — my biggest aging lever

My epigenetic clocks point to immune aging as the main driver of my pace of aging. A deep immune panel shows a Th2-skewed profile and a low white-count (an expected Rapamycin effect), so I target it with food-sensitivity work, gut health, and immune-balancing support.

Cyrex 2025-11: Th2-dominant (~2× ref), Th17 low, WBC 2977 · immune aging = primary GrimAge contributor
Educational n-of-1 documentation — not medical advice. Product links are affiliate (rel="sponsored"); you often save and it supports the site. © Dave Pascoe